
 Yahoo Finance
 What does Brambles Limited’s (ASX:BXB) Balance Sheet Tell Us About Its Future?

Investors seeking to preserve capital in a volatile environment might consider large-cap stocks such as Brambles Limited (ASX:BXB) a safer option. Market participants who are conscious of risk tend to search for large firms, attracted by the prospect of varied revenue sources and strong returns on capital. But, the key to extending previous success is in the health of the company’s financials. Today we will look at Brambles’s financial liquidity and debt levels, which are strong indicators for whether the company can weather economic downturns or fund strategic acquisitions for future growth. Note that this information is centred entirely on financial health and is a high-level overview, so I encourage you to look further into BXB here. See our latest analysis for Brambles
Does BXB produce enough cash relative to debt?
BXB has sustained its debt level by about AU$2.73b over the last 12 months made up of current and long term debt. At this current level of debt, BXB’s cash and short-term investments stands at AU$159.70m for investing into the business. Moreover, BXB has generated cash from operations of AU$1.21b over the same time period, resulting in an operating cash to total debt ratio of 44.33%, indicating that BXB’s debt is appropriately covered by operating cash. This ratio can also be a sign of operational efficiency as an alternative to return on assets. In BXB’s case, it is able to generate 0.44x cash from its debt capital.
Does BXB’s liquid assets cover its short-term commitments?
Looking at BXB’s most recent AU$2.12b liabilities, it seems that the business is not able to meet these obligations given the level of current assets of AU$1.59b, with a current ratio of 0.75x below the prudent level of 3x.
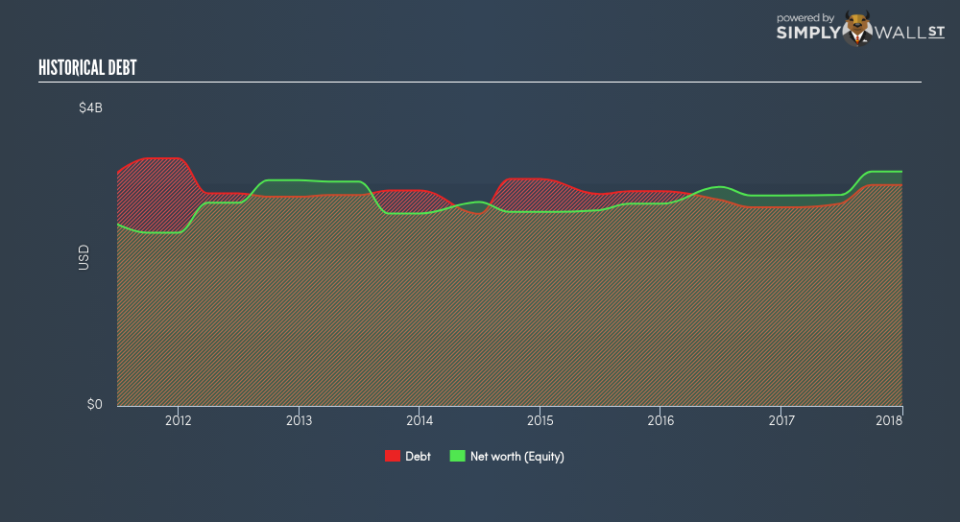
Is BXB’s debt level acceptable?
With debt reaching 94.29% of equity, BXB may be thought of as relatively highly levered. This isn’t surprising for large-caps, as equity can often be more expensive to issue than debt, plus interest payments are tax deductible. Consequently, larger-cap organisations tend to enjoy lower cost of capital as a result of easily attained financing, providing an advantage over smaller companies. We can test if BXB’s debt levels are sustainable by measuring interest payments against earnings of a company. A company generating earnings after interest and tax at least three times its net interest payments is considered financially sound. In BXB’s case, the ratio of 8.85x suggests that interest is well-covered. Large-cap investments like BXB are often believed to be a safe investment due to their ability to pump out ample earnings multiple times its interest payments.
Next Steps:
BXB’s high cash coverage means that, although its debt levels are high, the company is able to utilise its borrowings efficiently in order to generate cash flow. However, its low liquidity raises concerns over whether current asset management practices are properly implemented for the large-cap. This is only a rough assessment of financial health, and I’m sure BXB has company-specific issues impacting its capital structure decisions. I suggest you continue to research Brambles to get a more holistic view of the stock by looking at:
Future Outlook: What are well-informed industry analysts predicting for BXB’s future growth? Take a look at our free research report of analyst consensus for BXB’s outlook.
Valuation: What is BXB worth today? Is the stock undervalued, even when its growth outlook is factored into its intrinsic value? The intrinsic value infographic in our free research report helps visualize whether BXB is currently mispriced by the market.
Other High-Performing Stocks: Are there other stocks that provide better prospects with proven track records? Explore our free list of these great stocks here.
To help readers see pass the short term volatility of the financial market, we aim to bring you a long-term focused research analysis purely driven by fundamental data. Note that our analysis does not factor in the latest price sensitive company announcements.
The author is an independent contributor and at the time of publication had no position in the stocks mentioned.
