
 Yahoo Finance
 What does Best Buy Co., Inc.’s (NYSE:BBY) Balance Sheet Tell Us About Its Future?

Want to participate in a short research study? Help shape the future of investing tools and receive a $20 prize!
Best Buy Co., Inc. (NYSE:BBY), a large-cap worth US$16b, comes to mind for investors seeking a strong and reliable stock investment. Doing business globally, large caps tend to have diversified revenue streams and attractive capital returns, making them desirable investments for risk-averse portfolios. But, its financial health remains the key to continued success. This article will examine Best Buy’s financial liquidity and debt levels to get an idea of whether the company can deal with cyclical downturns and maintain funds to accommodate strategic spending for future growth. Note that this commentary is very high-level and solely focused on financial health, so I suggest you dig deeper yourself into BBY here.
See our latest analysis for Best Buy
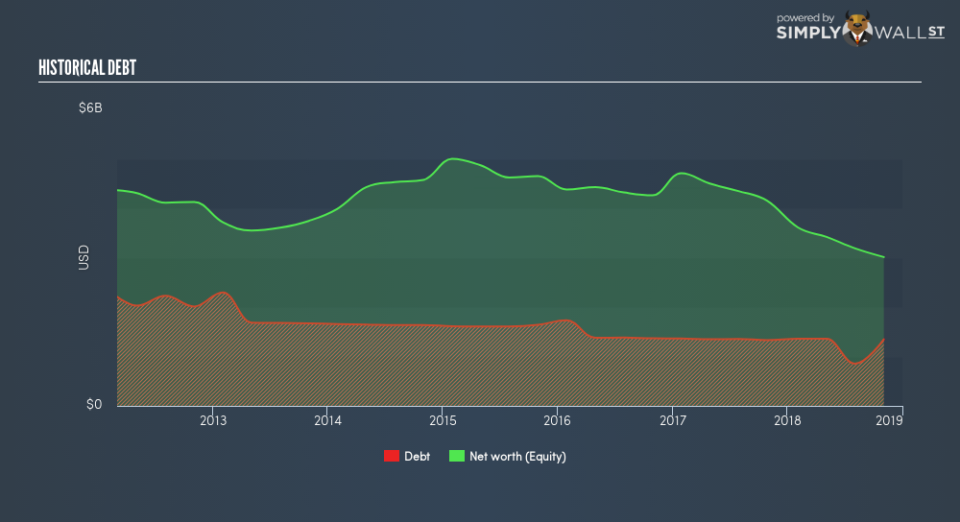
Does BBY produce enough cash relative to debt?
BBY’s debt level has been constant at around US$1.3b over the previous year including long-term debt. At this stable level of debt, BBY currently has US$1.5b remaining in cash and short-term investments for investing into the business. On top of this, BBY has produced cash from operations of US$2.0b during the same period of time, resulting in an operating cash to total debt ratio of 152%, indicating that BBY’s debt is appropriately covered by operating cash. This ratio can also be a sign of operational efficiency as an alternative to return on assets. In BBY’s case, it is able to generate 1.52x cash from its debt capital.
Can BBY meet its short-term obligations with the cash in hand?
With current liabilities at US$9.9b, it seems that the business has been able to meet these obligations given the level of current assets of US$11b, with a current ratio of 1.1x. For Specialty Retail companies, this ratio is within a sensible range as there’s enough of a cash buffer without holding too much capital in low return investments.
Does BBY face the risk of succumbing to its debt-load?
With a debt-to-equity ratio of 45%, BBY can be considered as an above-average leveraged company. This isn’t uncommon for large companies because interest payments on debt are tax deductible, meaning debt can be a cheaper source of capital than equity. Consequently, larger-cap organisations tend to enjoy lower cost of capital as a result of easily attained financing, providing an advantage over smaller companies. By measuring how many times BBY’s earnings can cover interest payments, we can evaluate whether its level of debt is sustainable or not. Net interest should be covered by earnings before interest and tax (EBIT) by at least three times to be safe. In BBY’s case, the ratio of 110x suggests that interest is comfortably covered. High interest coverage is seen as a responsible and safe practice, which highlights why most investors believe large-caps such as BBY is a safe investment.
Next Steps:
Although BBY’s debt level is towards the higher end of the spectrum, its cash flow coverage seems adequate to meet obligations which means its debt is being efficiently utilised. This may mean this is an optimal capital structure for the business, given that it is also meeting its short-term commitment. Keep in mind I haven’t considered other factors such as how BBY has been performing in the past. I recommend you continue to research Best Buy to get a better picture of the large-cap by looking at:
Future Outlook: What are well-informed industry analysts predicting for BBY’s future growth? Take a look at our free research report of analyst consensus for BBY’s outlook.
Valuation: What is BBY worth today? Is the stock undervalued, even when its growth outlook is factored into its intrinsic value? The intrinsic value infographic in our free research report helps visualize whether BBY is currently mispriced by the market.
Other High-Performing Stocks: Are there other stocks that provide better prospects with proven track records? Explore our free list of these great stocks here.
We aim to bring you long-term focused research analysis driven by fundamental data. Note that our analysis may not factor in the latest price-sensitive company announcements or qualitative material.
If you spot an error that warrants correction, please contact the editor at editorial-team@simplywallst.com. This article by Simply Wall St is general in nature. It does not constitute a recommendation to buy or sell any stock, and does not take account of your objectives, or your financial situation. Simply Wall St has no position in the stocks mentioned. On rare occasion, data errors may occur. Thank you for reading.
