
 Yahoo Finance
 How Does Beacon Lighting Group's (ASX:BLX) P/E Compare To Its Industry, After The Share Price Drop?

To the annoyance of some shareholders, Beacon Lighting Group (ASX:BLX) shares are down a considerable 33% in the last month. Indeed the recent decline has arguably caused some bitterness for shareholders who have held through the 39% drop over twelve months.
Assuming nothing else has changed, a lower share price makes a stock more attractive to potential buyers. In the long term, share prices tend to follow earnings per share, but in the short term prices bounce around in response to short term factors (which are not always obvious). The implication here is that long term investors have an opportunity when expectations of a company are too low. One way to gauge market expectations of a stock is to look at its Price to Earnings Ratio (PE Ratio). A high P/E implies that investors have high expectations of what a company can achieve compared to a company with a low P/E ratio.
View our latest analysis for Beacon Lighting Group
Does Beacon Lighting Group Have A Relatively High Or Low P/E For Its Industry?
We can tell from its P/E ratio of 9.11 that sentiment around Beacon Lighting Group isn't particularly high. We can see in the image below that the average P/E (10.3) for companies in the specialty retail industry is higher than Beacon Lighting Group's P/E.
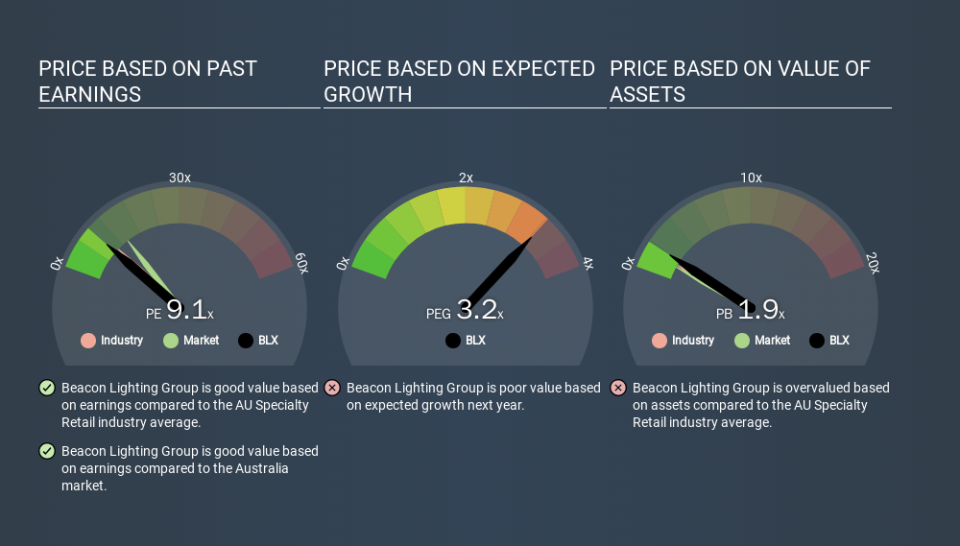
Beacon Lighting Group's P/E tells us that market participants think it will not fare as well as its peers in the same industry. Many investors like to buy stocks when the market is pessimistic about their prospects. If you consider the stock interesting, further research is recommended. For example, I often monitor director buying and selling.
How Growth Rates Impact P/E Ratios
Earnings growth rates have a big influence on P/E ratios. That's because companies that grow earnings per share quickly will rapidly increase the 'E' in the equation. Therefore, even if you pay a high multiple of earnings now, that multiple will become lower in the future. Then, a lower P/E should attract more buyers, pushing the share price up.
Beacon Lighting Group saw earnings per share decrease by 15% last year. But over the longer term (5 years) earnings per share have increased by 3.4%.
Remember: P/E Ratios Don't Consider The Balance Sheet
The 'Price' in P/E reflects the market capitalization of the company. That means it doesn't take debt or cash into account. Hypothetically, a company could reduce its future P/E ratio by spending its cash (or taking on debt) to achieve higher earnings.
Spending on growth might be good or bad a few years later, but the point is that the P/E ratio does not account for the option (or lack thereof).
How Does Beacon Lighting Group's Debt Impact Its P/E Ratio?
Net debt totals just 4.5% of Beacon Lighting Group's market cap. The market might award it a higher P/E ratio if it had net cash, but its unlikely this low level of net borrowing is having a big impact on the P/E multiple.
The Bottom Line On Beacon Lighting Group's P/E Ratio
Beacon Lighting Group has a P/E of 9.1. That's below the average in the AU market, which is 13.9. Since it only carries a modest debt load, it's likely the low expectations implied by the P/E ratio arise from the lack of recent earnings growth. Given Beacon Lighting Group's P/E ratio has declined from 13.6 to 9.1 in the last month, we know for sure that the market is more worried about the business today, than it was back then. For those who prefer to invest with the flow of momentum, that might be a bad sign, but for deep value investors this stock might justify some research.
When the market is wrong about a stock, it gives savvy investors an opportunity. If the reality for a company is not as bad as the P/E ratio indicates, then the share price should increase as the market realizes this. So this free visualization of the analyst consensus on future earnings could help you make the right decision about whether to buy, sell, or hold.
You might be able to find a better buy than Beacon Lighting Group. If you want a selection of possible winners, check out this free list of interesting companies that trade on a P/E below 20 (but have proven they can grow earnings).
If you spot an error that warrants correction, please contact the editor at editorial-team@simplywallst.com. This article by Simply Wall St is general in nature. It does not constitute a recommendation to buy or sell any stock, and does not take account of your objectives, or your financial situation. Simply Wall St has no position in the stocks mentioned.
We aim to bring you long-term focused research analysis driven by fundamental data. Note that our analysis may not factor in the latest price-sensitive company announcements or qualitative material. Thank you for reading.
