
 Yahoo Finance
 Does Ameren Corporation (NYSE:AEE) Have A Place In Your Dividend Portfolio?

Today we'll take a closer look at Ameren Corporation (NYSE:AEE) from a dividend investor's perspective. Owning a strong business and reinvesting the dividends is widely seen as an attractive way of growing your wealth. On the other hand, investors have been known to buy a stock because of its yield, and then lose money if the company's dividend doesn't live up to expectations.
A 2.3% yield is nothing to get excited about, but investors probably think the long payment history suggests Ameren has some staying power. Some simple analysis can offer a lot of insights when buying a company for its dividend, and we'll go through this below.
Click the interactive chart for our full dividend analysis
Payout ratios
Companies (usually) pay dividends out of their earnings. If a company is paying more than it earns, the dividend might have to be cut. So we need to form a view on if a company's dividend is sustainable, relative to its net profit after tax. In the last year, Ameren paid out 58% of its profit as dividends. This is a fairly normal payout ratio among most businesses. It allows a higher dividend to be paid to shareholders, but does limit the capital retained in the business - which could be good or bad.
In addition to comparing dividends against profits, we should inspect whether the company generated enough cash to pay its dividend. Unfortunately, while Ameren pays a dividend, it also reported negative free cash flow last year. While there may be a good reason for this, it's not ideal from a dividend perspective.
Is Ameren's Balance Sheet Risky?
As Ameren has a meaningful amount of debt, we need to check its balance sheet to see if the company might have debt risks. A rough way to check this is with these two simple ratios: a) net debt divided by EBITDA (earnings before interest, tax, depreciation and amortisation), and b) net interest cover. Net debt to EBITDA measures total debt load relative to company earnings (lower = less debt), while net interest cover measures the ability to pay interest on the debt (higher = greater ability to pay interest costs). Ameren has net debt of 4.08 times its EBITDA, which is getting towards the limit of most investors' comfort zones. Judicious use of debt can enhance shareholder returns, but also adds to the risk if something goes awry.
We calculated its interest cover by measuring its earnings before interest and tax (EBIT), and dividing this by the company's net interest expense. Interest cover of 3.76 times its interest expense is starting to become a concern for Ameren, and be aware that lenders may place additional restrictions on the company as well.
Remember, you can always get a snapshot of Ameren's latest financial position, by checking our visualisation of its financial health.
Dividend Volatility
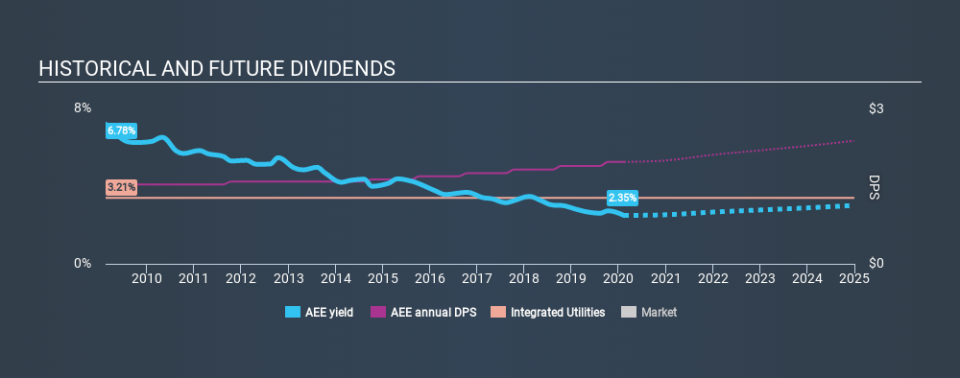
One of the major risks of relying on dividend income, is the potential for a company to struggle financially and cut its dividend. Not only is your income cut, but the value of your investment declines as well - nasty. For the purpose of this article, we only scrutinise the last decade of Ameren's dividend payments. During this period the dividend has been stable, which could imply the business could have relatively consistent earnings power. During the past ten-year period, the first annual payment was US$1.54 in 2010, compared to US$1.98 last year. This works out to be a compound annual growth rate (CAGR) of approximately 2.5% a year over that time.
Dividends have grown relatively slowly, which is not great, but some investors may value the relative consistency of the dividend.
Dividend Growth Potential
Dividend payments have been consistent over the past few years, but we should always check if earnings per share (EPS) are growing, as this will help maintain the purchasing power of the dividend. Ameren has grown its earnings per share at 9.2% per annum over the past five years. The rate at which earnings have grown is quite decent, and by paying out more than half of its earnings as dividends, the company is striking a reasonable balance between reinvestment and returns to shareholders.
Conclusion
Dividend investors should always want to know if a) a company's dividends are affordable, b) if there is a track record of consistent payments, and c) if the dividend is capable of growing. First, the company has a payout ratio that was within an average range for most dividend stocks, but it paid out virtually all of its generated cash flow. We like that it has been delivering solid improvement in its earnings per share, and relatively consistent dividend payments. While we're not hugely bearish on it, overall we think there are potentially better dividend stocks than Ameren out there.
Companies that are growing earnings tend to be the best dividend stocks over the long term. See what the 10 analysts we track are forecasting for Ameren for free with public analyst estimates for the company.
Looking for more high-yielding dividend ideas? Try our curated list of dividend stocks with a yield above 3%.
If you spot an error that warrants correction, please contact the editor at editorial-team@simplywallst.com. This article by Simply Wall St is general in nature. It does not constitute a recommendation to buy or sell any stock, and does not take account of your objectives, or your financial situation. Simply Wall St has no position in the stocks mentioned.
We aim to bring you long-term focused research analysis driven by fundamental data. Note that our analysis may not factor in the latest price-sensitive company announcements or qualitative material. Thank you for reading.
