
 Yahoo Finance
 Is This New Dividend Aristocrat a Candidate for Income and Value Investors?
On April 28, International Business Machines Corp. (NYSE:IBM) became a member of the exclusive Dividend Aristocrats club. This club is made up of S&P 500 companies that have increased their dividends each year for at least 25 years.
Only 66 companies are on the list for 2020, and they are favorites of many investors, especially for income investors. Odds are high that these companies will increase their dividends by more than the inflation rate.
Warning! GuruFocus has detected 4 Warning Signs with IBM. Click here to check it out.
Arvind Krishna, IBM's CEO, "IBM's free cash flow and our strong balance sheet gives us confidence to both invest aggressively in cloud and AI technologies, while also returning value to our shareholders. We remain fully committed to our dividend even during this unprecedented time, and we recognize the importance of the dividend to the more than 2.3 million investors in IBM."
As Krishna's comments suggest, joining the club is about more than just the dividend--it is a signal of confidence to the investing community.
Is that confidence justified? We'll form our own opinion by reviewing key fundamentals and dividend information.
Financial strength
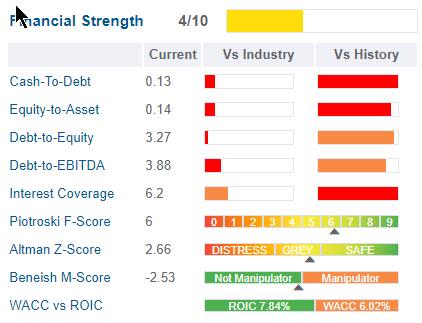
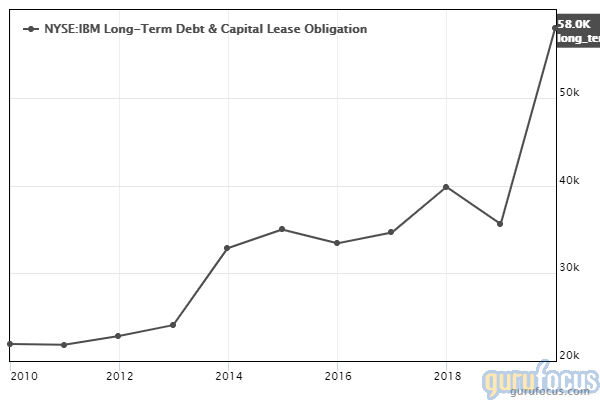
In addition to the data here, the GuruFocus system posts a medium warning about the growth of long-term debt. That's consistent with what we see in the table, and this chart shows how much it has grown in the past decade:
In the table, we see that IBM's interest coverage is more than 6.0, meaning the company's operating income is enough to cover the interest expense multiple times. The legendary Benjamin Graham argued a stock should have at least five times interest coverage.
Profitability
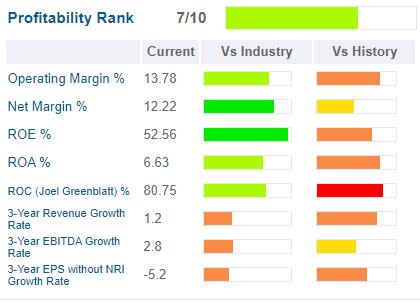
Overall, a score of 7 out of 10 for profitability is respectable, with room for improvement. Margins are in the low double-digits, but return on equity is very high at 52.56 and that is an excellent return for investors.
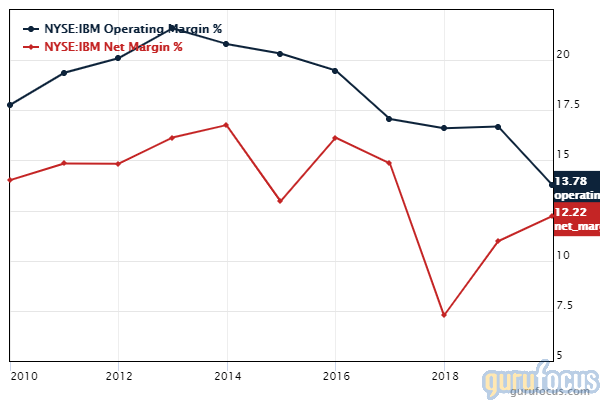
GuruFocus does warn, though, that IBM's margins have declined. Looking at a chart of the operating and net margins, we see they have been under pressure for about seven years:
We also see its revenue and Ebitda growth rate have been weak for the past three years.
Valuation
This is an area in which value investors will come to attention:
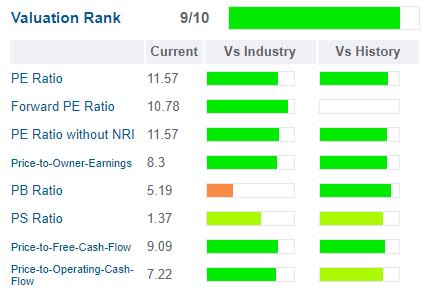
The high rating means the stock comes with a bargain price tag. However, cheap may not be a good sign if the share price is in a long-term decline:
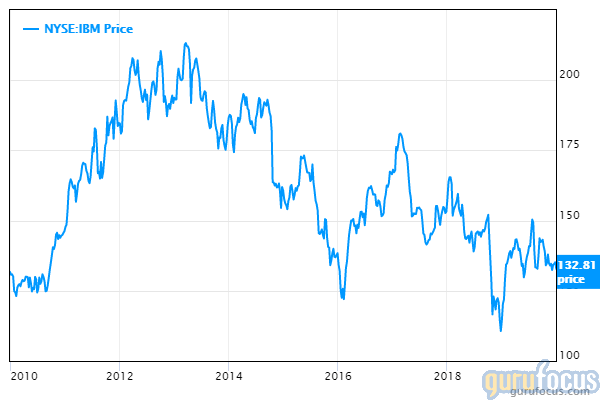
The green bars next to the price-earnings ratio and forward price-earnings indicate the price is low compared to both IBM's competition and its own history. That's good, but if you buy this stock, you should be prepared for capital losses.
Dividends and buybacks
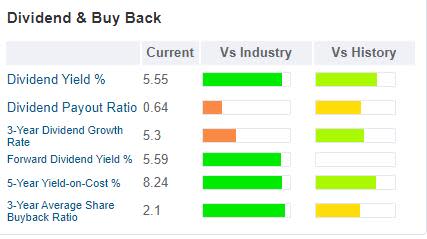
IBM offers a relatively rich dividend at 5.6% and, as we've noted, it has grown every year for the past 25 years. Here is the yield shown in the context of its own share price:
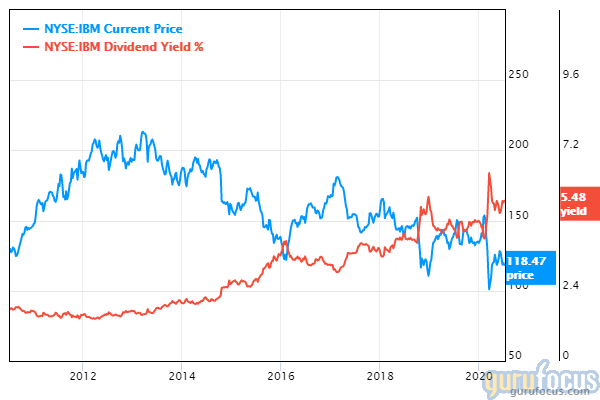
A couple of notes: First, we see that the current yield is due in part to the falling stock price. Second, if we were to draw a trend line over the past eight years, we would know the richness of the yield is also due to board policy.
Dividend payout ratio
At 64%, the payout ratio is likely safe. But to confirm that, we would want to see how free cash flow has been trending:
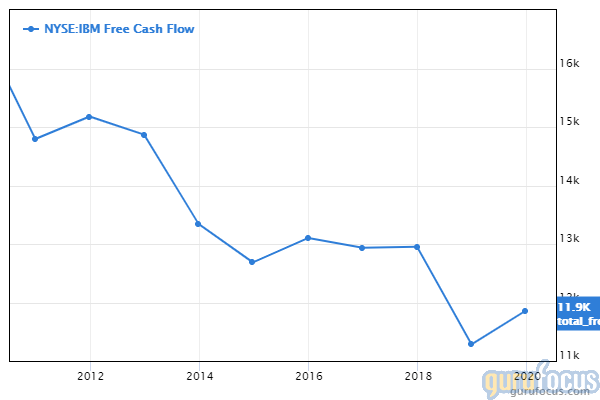
After mostly declining for nine years, IBM made a modest recovery in the past year. Which direction will free cash flow move in succeeding years?
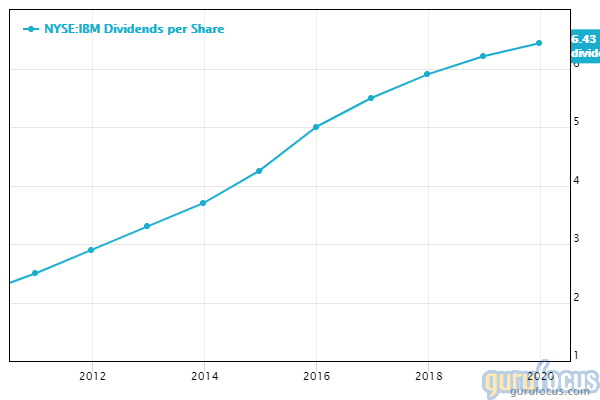
Three-year dividend growth rate
Over the past three years, the dividend has grown by an average of 5.3% per year, which would represent significant growth for most investors.
From the steady slope of this chart, it appears IBM has been logging similar increases for the past decade:
Forward dividend yield
The forward yield, at 5.63%, is only slightly higher than the trailing 12-month yield at 5.6%.
The difference? That one-cent increase, from $1.62 to $1.63, discussed above.
Five-year yield on cost
This is the average annual return that investors can expect over the next five years, based on two assumptions:
Investors buy and hold the stock for five years.
That IBM continues to increase the dividend for the next five years as it did over the past five years.
An average of 8.24% per year is attractive, especially when we recognize the company may also continue to buy back its own shares as well. We can add gains from buybacks to the 8.24% as well as possible capital gains, for what could be a double-digit growth rate.
Share buybacks
The three-year average share buyback ratio is 2.1, and depending on the moods of Mr. Market, could add to investors' total returns.
This chart, showing shares outstanding over the past 10 years, indicates the company has a history of steadily buying back shares to increase the value of its remaining shares:
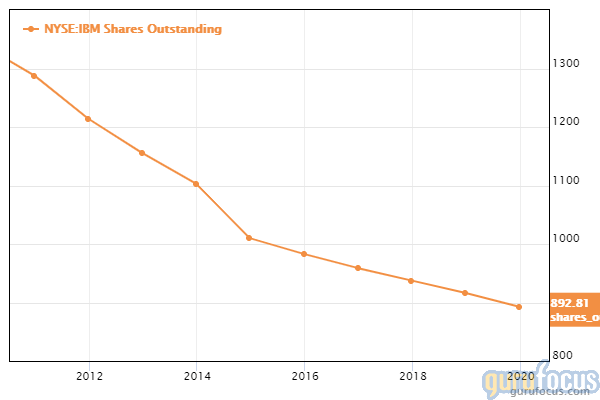
In the short term, it makes sense to repurchase shares if the stock price is falling. But when the share price is in a long-term downtrend, then the "bargain prices" of several years earlier don't look like bargains now.
Gurus
Eleven of the gurus followed by GuruFocus hold positions in IBM, and judging by the following chart, the number has been decreasing for the past two years:
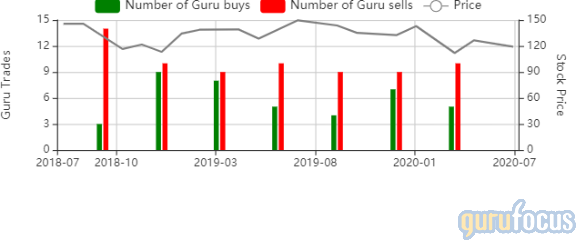
Pioneer Investments (Trades, Portfolio) held the largest position at the end of the first quarter with 1,595,605 shares, a 40.41% reduction from the previous quarter. That represented 0.18% of IBM's shares outstanding and 0.16% of the Pioneer portfolio.
The Parnassus Endeavor Fund (Trades, Portfolio) also reduced its holding in the first quarter, reducing its share count by 5.88% to 800,000 shares.
Joel Greenblatt (Trades, Portfolio) of Gotham Asset Management added 11.57% during the quarter, increasing his share count to 176,470.
Conclusion
For an income investor, IBM offers an attractive package of dividends and buybacks. Between them, an investor might enjoy a low, double-digit return over the next five years. Against that, though, the investor also has to consider potential capital losses. The price trend of the past decade is not an investor's friend.
Value investors, on the other hand, will want to look elsewhere. The declining share price (long term), growing debt, shrinking margins and slowing cash flows should raise red flags for investors. Perhaps management can reverse the fundamentals, but until they show consistent improvements, value investors should beware.
Disclosure: I do not own shares in any companies named in this article.
Read more here:
Walgreens Boots: A Bargain Stock, But at What Price?
Should You Buy this Buffett Stock for its Dividends?
Is GlaxoSmithKline's Dividend Enough to Offset Its Slowing Cash Flow?
Not a Premium Member of GuruFocus? Sign up for a free 7-day trial here.
This article first appeared on GuruFocus.
Warning! GuruFocus has detected 4 Warning Signs with IBM. Click here to check it out.
This Powerful Chart Made Peter Lynch 29% A Year For 13 Years
How to calculate the intrinsic value of a stock?
