
 Yahoo Finance
 Did You Participate In Any Of Softcat's (LON:SCT) Fantastic 156% Return ?
The worst result, after buying shares in a company (assuming no leverage), would be if you lose all the money you put in. But in contrast you can make much more than 100% if the company does well. To wit, the Softcat plc (LON:SCT) share price has flown 130% in the last three years. That sort of return is as solid as granite. In the last week shares have slid back 6.2%.
Check out our latest analysis for Softcat
While markets are a powerful pricing mechanism, share prices reflect investor sentiment, not just underlying business performance. By comparing earnings per share (EPS) and share price changes over time, we can get a feel for how investor attitudes to a company have morphed over time.
During three years of share price growth, Softcat achieved compound earnings per share growth of 23% per year. In comparison, the 32% per year gain in the share price outpaces the EPS growth. This indicates that the market is feeling more optimistic on the stock, after the last few years of progress. It's not unusual to see the market 're-rate' a stock, after a few years of growth.
You can see below how EPS has changed over time (discover the exact values by clicking on the image).
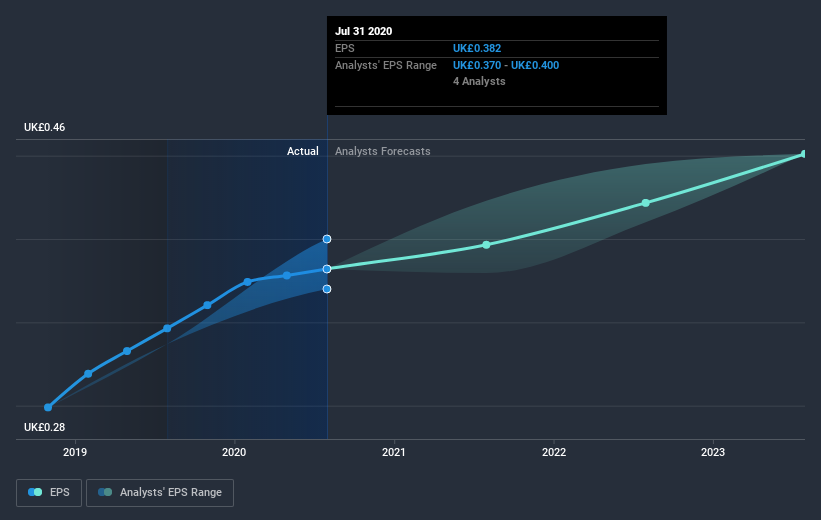
It's probably worth noting that the CEO is paid less than the median at similar sized companies. It's always worth keeping an eye on CEO pay, but a more important question is whether the company will grow earnings throughout the years. Before buying or selling a stock, we always recommend a close examination of historic growth trends, available here..
What about the Total Shareholder Return (TSR)?
We'd be remiss not to mention the difference between Softcat's total shareholder return (TSR) and its share price return. The TSR is a return calculation that accounts for the value of cash dividends (assuming that any dividend received was reinvested) and the calculated value of any discounted capital raisings and spin-offs. Dividends have been really beneficial for Softcat shareholders, and that cash payout contributed to why its TSR of 156%, over the last 3 years, is better than the share price return.
A Different Perspective
Pleasingly, Softcat's total shareholder return last year was 25%. But the three year TSR of 37% per year is even better. It's always interesting to track share price performance over the longer term. But to understand Softcat better, we need to consider many other factors. For instance, we've identified 1 warning sign for Softcat that you should be aware of.
If you are like me, then you will not want to miss this free list of growing companies that insiders are buying.
Please note, the market returns quoted in this article reflect the market weighted average returns of stocks that currently trade on GB exchanges.
This article by Simply Wall St is general in nature. It does not constitute a recommendation to buy or sell any stock, and does not take account of your objectives, or your financial situation. We aim to bring you long-term focused analysis driven by fundamental data. Note that our analysis may not factor in the latest price-sensitive company announcements or qualitative material. Simply Wall St has no position in any stocks mentioned.
Have feedback on this article? Concerned about the content? Get in touch with us directly. Alternatively, email editorial-team@simplywallst.com.
