
 Yahoo Finance
 Did You Miss NXP Semiconductors's (NASDAQ:NXPI) 52% Share Price Gain?
Generally speaking the aim of active stock picking is to find companies that provide returns that are superior to the market average. Buying under-rated businesses is one path to excess returns. For example, long term NXP Semiconductors N.V. (NASDAQ:NXPI) shareholders have enjoyed a 52% share price rise over the last half decade, well in excess of the market return of around 35% (not including dividends). However, more recent returns haven't been as impressive as that, with the stock returning just 12% in the last year, including dividends.
See our latest analysis for NXP Semiconductors
In his essay The Superinvestors of Graham-and-Doddsville Warren Buffett described how share prices do not always rationally reflect the value of a business. One flawed but reasonable way to assess how sentiment around a company has changed is to compare the earnings per share (EPS) with the share price.
Over half a decade, NXP Semiconductors managed to grow its earnings per share at 27% a year. The EPS growth is more impressive than the yearly share price gain of 8.8% over the same period. So one could conclude that the broader market has become more cautious towards the stock.
The graphic below depicts how EPS has changed over time (unveil the exact values by clicking on the image).
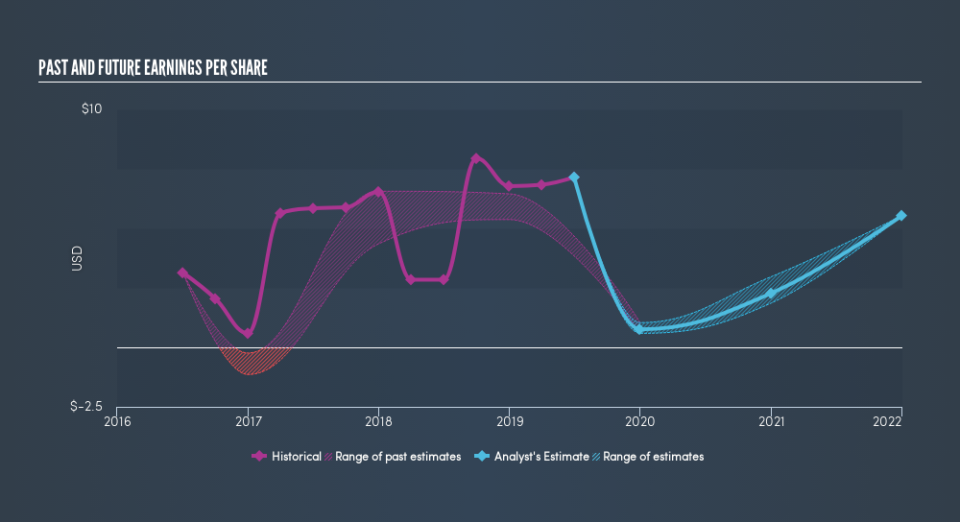
We know that NXP Semiconductors has improved its bottom line over the last three years, but what does the future have in store? It might be well worthwhile taking a look at our free report on how its financial position has changed over time.
A Different Perspective
It's nice to see that NXP Semiconductors shareholders have received a total shareholder return of 12% over the last year. Of course, that includes the dividend. That gain is better than the annual TSR over five years, which is 9.0%. Therefore it seems like sentiment around the company has been positive lately. Given the share price momentum remains strong, it might be worth taking a closer look at the stock, lest you miss an opportunity. Before spending more time on NXP Semiconductors it might be wise to click here to see if insiders have been buying or selling shares.
Of course NXP Semiconductors may not be the best stock to buy. So you may wish to see this free collection of growth stocks.
Please note, the market returns quoted in this article reflect the market weighted average returns of stocks that currently trade on US exchanges.
We aim to bring you long-term focused research analysis driven by fundamental data. Note that our analysis may not factor in the latest price-sensitive company announcements or qualitative material.
If you spot an error that warrants correction, please contact the editor at editorial-team@simplywallst.com. This article by Simply Wall St is general in nature. It does not constitute a recommendation to buy or sell any stock, and does not take account of your objectives, or your financial situation. Simply Wall St has no position in the stocks mentioned. Thank you for reading.
