
 Yahoo Finance
 Did You Miss General Dynamics' (NYSE:GD) 45% Share Price Gain?
We believe investing is smart because history shows that stock markets go higher in the long term. But not every stock you buy will perform as well as the overall market. Over the last year the General Dynamics Corporation (NYSE:GD) share price is up 45%, but that's less than the broader market return. Unfortunately the longer term returns are not so good, with the stock falling 4.2% in the last three years.
View our latest analysis for General Dynamics
In his essay The Superinvestors of Graham-and-Doddsville Warren Buffett described how share prices do not always rationally reflect the value of a business. By comparing earnings per share (EPS) and share price changes over time, we can get a feel for how investor attitudes to a company have morphed over time.
Over the last twelve months, General Dynamics actually shrank its EPS by 6.8%.
So we don't think that investors are paying too much attention to EPS. Since the change in EPS doesn't seem to correlate with the change in share price, it's worth taking a look at other metrics.
Revenue was pretty flat year on year, but maybe a closer look at the data can explain the market optimism.
The company's revenue and earnings (over time) are depicted in the image below (click to see the exact numbers).
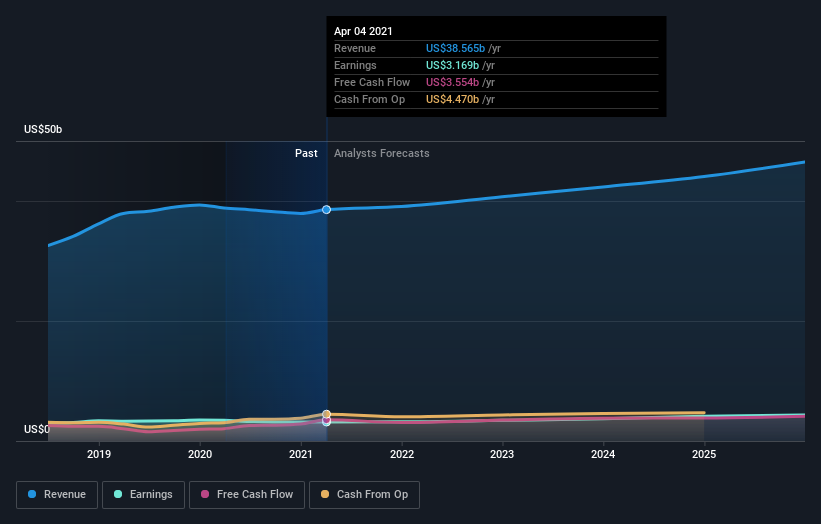
General Dynamics is well known by investors, and plenty of clever analysts have tried to predict the future profit levels. Given we have quite a good number of analyst forecasts, it might be well worth checking out this free chart depicting consensus estimates.
What About Dividends?
When looking at investment returns, it is important to consider the difference between total shareholder return (TSR) and share price return. The TSR incorporates the value of any spin-offs or discounted capital raisings, along with any dividends, based on the assumption that the dividends are reinvested. So for companies that pay a generous dividend, the TSR is often a lot higher than the share price return. As it happens, General Dynamics' TSR for the last year was 50%, which exceeds the share price return mentioned earlier. And there's no prize for guessing that the dividend payments largely explain the divergence!
A Different Perspective
General Dynamics shareholders have received returns of 50% over twelve months (even including dividends), which isn't far from the general market return. Most would be happy with a gain, and it helps that the year's return is actually better than the average return over five years, which was 8%. It is possible that management foresight will bring growth well into the future, even if the share price slows down. It's always interesting to track share price performance over the longer term. But to understand General Dynamics better, we need to consider many other factors. To that end, you should be aware of the 1 warning sign we've spotted with General Dynamics .
Of course, you might find a fantastic investment by looking elsewhere. So take a peek at this free list of companies we expect will grow earnings.
Please note, the market returns quoted in this article reflect the market weighted average returns of stocks that currently trade on US exchanges.
This article by Simply Wall St is general in nature. It does not constitute a recommendation to buy or sell any stock, and does not take account of your objectives, or your financial situation. We aim to bring you long-term focused analysis driven by fundamental data. Note that our analysis may not factor in the latest price-sensitive company announcements or qualitative material. Simply Wall St has no position in any stocks mentioned.
Have feedback on this article? Concerned about the content? Get in touch with us directly. Alternatively, email editorial-team (at) simplywallst.com.
