
 Yahoo Finance
 Did Medibank Private Limited’s (ASX:MPL) Recent Earnings Growth Beat The Trend?

When Medibank Private Limited (ASX:MPL) announced its most recent earnings (31 December 2017), I did two things: looked at its past earnings track record, then look at what is happening in the industry. Understanding how Medibank Private performed requires a benchmark rather than trying to assess a standalone number at one point in time. Below is a quick commentary on how I see MPL has performed. View out our latest analysis for Medibank Private
Did MPL’s recent earnings growth beat the long-term trend and the industry?
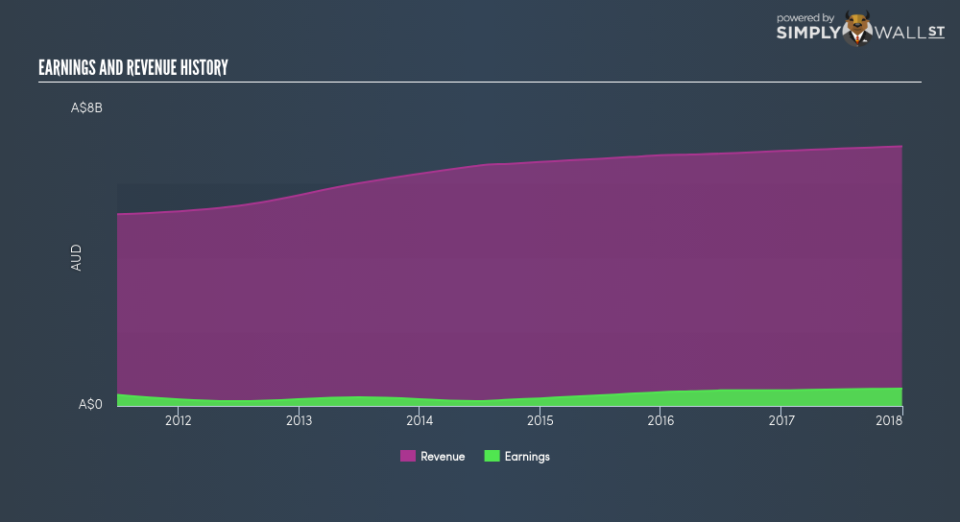
MPL’s trailing twelve-month earnings (from 31 December 2017) of AU$463.20m has increased by 9.79% compared to the previous year. However, this one-year growth rate has been lower than its average earnings growth rate over the past 5 years of 15.71%, indicating the rate at which MPL is growing has slowed down. What could be happening here? Well, let’s take a look at what’s going on with margins and if the rest of the industry is feeling the heat.
In the past few years, revenue growth has not been able to catch up, which suggests that Medibank Private’s bottom line has been propelled by unmaintainable cost-reductions. Scanning growth from a sector-level, the Australian insurance industry has been growing, albeit, at a unexciting single-digit rate of 3.89% over the previous year, and a substantial 13.40% over the past half a decade. This shows that any recent headwind the industry is enduring, Medibank Private is less exposed compared to its peers.
In terms of returns from investment, Medibank Private has invested its equity funds well leading to a 26.04% return on equity (ROE), above the sensible minimum of 20%. Furthermore, its return on assets (ROA) of 14.29% exceeds the AU Insurance industry of 4.70%, indicating Medibank Private has used its assets more efficiently. And finally, its return on capital (ROC), which also accounts for Medibank Private’s debt level, has increased over the past 3 years from 21.36% to 33.17%.
What does this mean?
Medibank Private’s track record can be a valuable insight into its earnings performance, but it certainly doesn’t tell the whole story. Companies that have performed well in the past, such as Medibank Private gives investors conviction. However, the next step would be to assess whether the future looks as optimistic. I suggest you continue to research Medibank Private to get a better picture of the stock by looking at:
Future Outlook: What are well-informed industry analysts predicting for MPL’s future growth? Take a look at our free research report of analyst consensus for MPL’s outlook.
Financial Health: Is MPL’s operations financially sustainable? Balance sheets can be hard to analyze, which is why we’ve done it for you. Check out our financial health checks here.
Other High-Performing Stocks: Are there other stocks that provide better prospects with proven track records? Explore our free list of these great stocks here.
NB: Figures in this article are calculated using data from the trailing twelve months from 31 December 2017. This may not be consistent with full year annual report figures.
To help readers see pass the short term volatility of the financial market, we aim to bring you a long-term focused research analysis purely driven by fundamental data. Note that our analysis does not factor in the latest price sensitive company announcements.
The author is an independent contributor and at the time of publication had no position in the stocks mentioned.
