
 Yahoo Finance
 Did You Manage To Avoid CalAmp's (NASDAQ:CAMP) 38% Share Price Drop?

It's easy to match the overall market return by buying an index fund. While individual stocks can be big winners, plenty more fail to generate satisfactory returns. For example, the CalAmp Corp. (NASDAQ:CAMP) share price is down 38% in the last year. That contrasts poorly with the market return of 4.8%. However, the longer term returns haven't been so bad, with the stock down 11% in the last three years. It's down 1.2% in the last seven days.
Want to participate in a short research study? Help shape the future of investing tools and you could win a $250 gift card!
View our latest analysis for CalAmp
To paraphrase Benjamin Graham: Over the short term the market is a voting machine, but over the long term it's a weighing machine. One flawed but reasonable way to assess how sentiment around a company has changed is to compare the earnings per share (EPS) with the share price.
During the unfortunate twelve months during which the CalAmp share price fell, it actually saw its earnings per share (EPS) improve by 13%. Of course, the situation might betray previous over-optimism about growth. The divergence between the EPS and the share price is quite notable, during the year. So it's well worth checking out some other metrics, too.
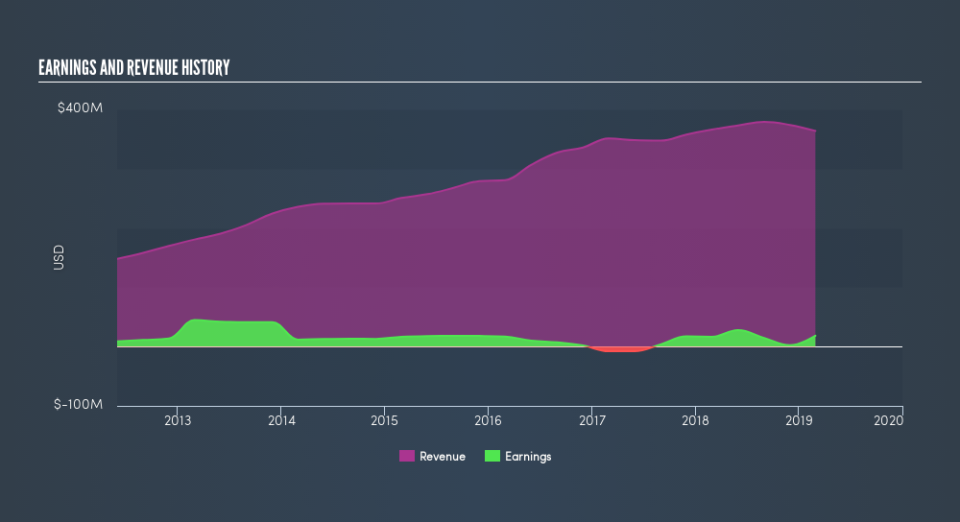
Revenue was fairly steady year on year, which isn't usually such a bad thing. But the share price might be lower because the market expected a meaningful improvement, and got none.
Depicted in the graphic below, you'll see revenue and earnings over time. If you want more detail, you can click on the chart itself.
CalAmp is a well known stock, with plenty of analyst coverage, suggesting some visibility into future growth. You can see what analysts are predicting for CalAmp in this interactive graph of future profit estimates.
A Different Perspective
Investors in CalAmp had a tough year, with a total loss of 38%, against a market gain of about 4.8%. However, keep in mind that even the best stocks will sometimes underperform the market over a twelve month period. Regrettably, last year's performance caps off a bad run, with the shareholders facing a total loss of 6.4% per year over five years. We realise that Buffett has said investors should 'buy when there is blood on the streets', but we caution that investors should first be sure they are buying a high quality businesses. Before spending more time on CalAmp it might be wise to click here to see if insiders have been buying or selling shares.
If you are like me, then you will not want to miss this free list of growing companies that insiders are buying.
Please note, the market returns quoted in this article reflect the market weighted average returns of stocks that currently trade on US exchanges.
We aim to bring you long-term focused research analysis driven by fundamental data. Note that our analysis may not factor in the latest price-sensitive company announcements or qualitative material.
If you spot an error that warrants correction, please contact the editor at editorial-team@simplywallst.com. This article by Simply Wall St is general in nature. It does not constitute a recommendation to buy or sell any stock, and does not take account of your objectives, or your financial situation. Simply Wall St has no position in the stocks mentioned. Thank you for reading.