
 Yahoo Finance
 Did Changing Sentiment Drive Computer Task Group's (NASDAQ:CTG) Share Price Down A Worrying 69%?

Generally speaking long term investing is the way to go. But that doesn't mean long term investors can avoid big losses. For example, after five long years the Computer Task Group, Incorporated (NASDAQ:CTG) share price is a whole 69% lower. That is extremely sub-optimal, to say the least. We also note that the stock has performed poorly over the last year, with the share price down 33%. But it's up 8.4% in the last week. Less than a week ago Computer Task Group announced its financial results; you can catch up on the most recent data by reading our company report.
Check out our latest analysis for Computer Task Group
In his essay The Superinvestors of Graham-and-Doddsville Warren Buffett described how share prices do not always rationally reflect the value of a business. One flawed but reasonable way to assess how sentiment around a company has changed is to compare the earnings per share (EPS) with the share price.
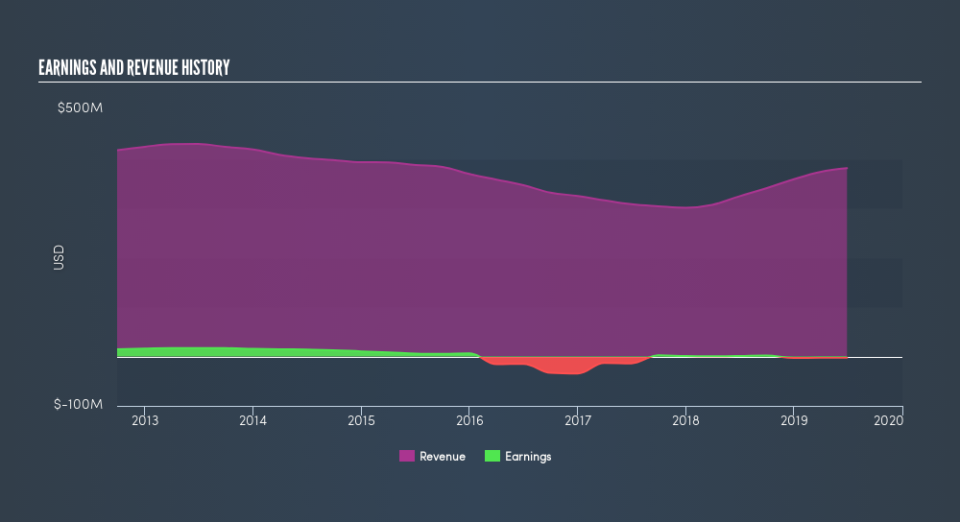
Computer Task Group became profitable within the last five years. On the other hand, it reported a trailing twelve months loss, suggesting it isn't reliably profitable. Other metrics might give us a better handle on how its value is changing over time.
Arguably, the revenue drop of 3.5% a year for half a decade suggests that the company can't grow in the long term. That could explain the weak share price.
The company's revenue and earnings (over time) are depicted in the image below (click to see the exact numbers).
Take a more thorough look at Computer Task Group's financial health with this free report on its balance sheet.
A Dividend Lost
The value of past dividends are accounted for in the total shareholder return (TSR), but not in the share price return mentioned above. In some ways, TSR is a better measure of how well an investment has performed. Over the last 5 years, Computer Task Group generated a TSR of -67%, which is, of course, better than the share price return. Although the company had to cut dividends, it has paid cash to shareholders in the past.
A Different Perspective
While the broader market gained around 6.2% in the last year, Computer Task Group shareholders lost 33%. However, keep in mind that even the best stocks will sometimes underperform the market over a twelve month period. Unfortunately, last year's performance may indicate unresolved challenges, given that it was worse than the annualised loss of 20% over the last half decade. Generally speaking long term share price weakness can be a bad sign, though contrarian investors might want to research the stock in hope of a turnaround. You could get a better understanding of Computer Task Group's growth by checking out this more detailed historical graph of earnings, revenue and cash flow.
Of course Computer Task Group may not be the best stock to buy. So you may wish to see this free collection of growth stocks.
Please note, the market returns quoted in this article reflect the market weighted average returns of stocks that currently trade on US exchanges.
We aim to bring you long-term focused research analysis driven by fundamental data. Note that our analysis may not factor in the latest price-sensitive company announcements or qualitative material.
If you spot an error that warrants correction, please contact the editor at editorial-team@simplywallst.com. This article by Simply Wall St is general in nature. It does not constitute a recommendation to buy or sell any stock, and does not take account of your objectives, or your financial situation. Simply Wall St has no position in the stocks mentioned. Thank you for reading.
