
 Yahoo Finance
 Did Abacus Property Group (ASX:ABP) Create Value For Investors Over The Past Year?

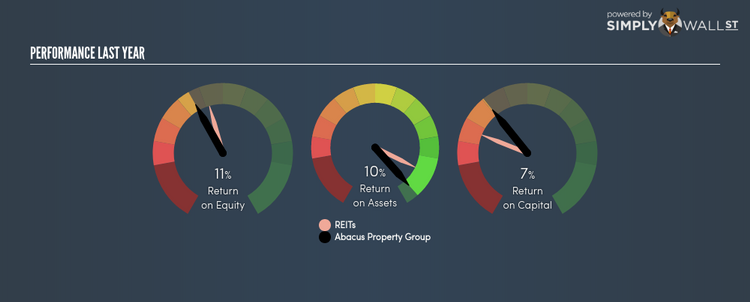
Abacus Property Group (ASX:ABP) delivered a less impressive 11.31% ROE over the past year, compared to the 13.45% return generated by its industry. ABP’s results could indicate a relatively inefficient operation to its peers, and while this may be the case, it is important to understand what ROE is made up of and how it should be interpreted. Knowing these components could change your view on ABP’s performance. Metrics such as financial leverage can impact the level of ROE which in turn can affect the sustainability of ABP’s returns. Let me show you what I mean by this. View our latest analysis for Abacus Property Group
Peeling the layers of ROE – trisecting a company’s profitability
Firstly, Return on Equity, or ROE, is simply the percentage of last years’ earning against the book value of shareholders’ equity. It essentially shows how much the company can generate in earnings given the amount of equity it has raised. In most cases, a higher ROE is preferred; however, there are many other factors we must consider prior to making any investment decisions.
Return on Equity = Net Profit ÷ Shareholders Equity
Returns are usually compared to costs to measure the efficiency of capital. Abacus Property Group’s cost of equity is 8.55%. While Abacus Property Group’s peers may have higher ROE, it may also incur higher cost of equity. An undesirable and unsustainable practice would be if returns exceeded cost. However, this is not the case for Abacus Property Group which is encouraging. ROE can be split up into three useful ratios: net profit margin, asset turnover, and financial leverage. This is called the Dupont Formula:
Dupont Formula
ROE = profit margin × asset turnover × financial leverage
ROE = (annual net profit ÷ sales) × (sales ÷ assets) × (assets ÷ shareholders’ equity)
ROE = annual net profit ÷ shareholders’ equity
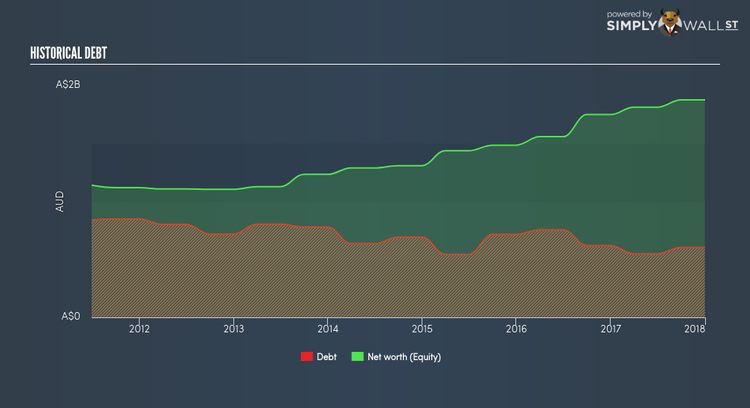
The first component is profit margin, which measures how much of sales is retained after the company pays for all its expenses. Asset turnover shows how much revenue Abacus Property Group can generate with its current asset base. And finally, financial leverage is simply how much of assets are funded by equity, which exhibits how sustainable the company’s capital structure is. Since ROE can be inflated by excessive debt, we need to examine Abacus Property Group’s debt-to-equity level. The debt-to-equity ratio currently stands at a low 32.18%, meaning Abacus Property Group still has headroom to borrow debt to increase profits.
Next Steps:
ROE is one of many ratios which meaningfully dissects financial statements, which illustrates the quality of a company. Although Abacus Property Group’s ROE is underwhelming relative to the industry average, its returns are high enough to cover the cost of equity. Also, ROE is not likely to be inflated by excessive debt funding, giving shareholders more conviction in the sustainability of returns, which has headroom to increase further. Although ROE can be a useful metric, it is only a small part of diligent research.
For Abacus Property Group, I’ve compiled three fundamental aspects you should further examine:
Financial Health: Does it have a healthy balance sheet? Take a look at our free balance sheet analysis with six simple checks on key factors like leverage and risk.
Valuation: What is Abacus Property Group worth today? Is the stock undervalued, even when its growth outlook is factored into its intrinsic value? The intrinsic value infographic in our free research report helps visualize whether Abacus Property Group is currently mispriced by the market.
Other High-Growth Alternatives : Are there other high-growth stocks you could be holding instead of Abacus Property Group? Explore our interactive list of stocks with large growth potential to get an idea of what else is out there you may be missing!
To help readers see pass the short term volatility of the financial market, we aim to bring you a long-term focused research analysis purely driven by fundamental data. Note that our analysis does not factor in the latest price sensitive company announcements.
The author is an independent contributor and at the time of publication had no position in the stocks mentioned.
