
 Yahoo Finance
 Despite lower earnings than three years ago, Kimco Realty (NYSE:KIM) investors are up 107% since then
It might be of some concern to shareholders to see the Kimco Realty Corporation (NYSE:KIM) share price down 13% in the last month. But over three years, the returns would have left most investors smiling After all, the share price is up a market-beating 82% in that time.
While this past week has detracted from the company's three-year return, let's look at the recent trends of the underlying business and see if the gains have been in alignment.
See our latest analysis for Kimco Realty
While markets are a powerful pricing mechanism, share prices reflect investor sentiment, not just underlying business performance. By comparing earnings per share (EPS) and share price changes over time, we can get a feel for how investor attitudes to a company have morphed over time.
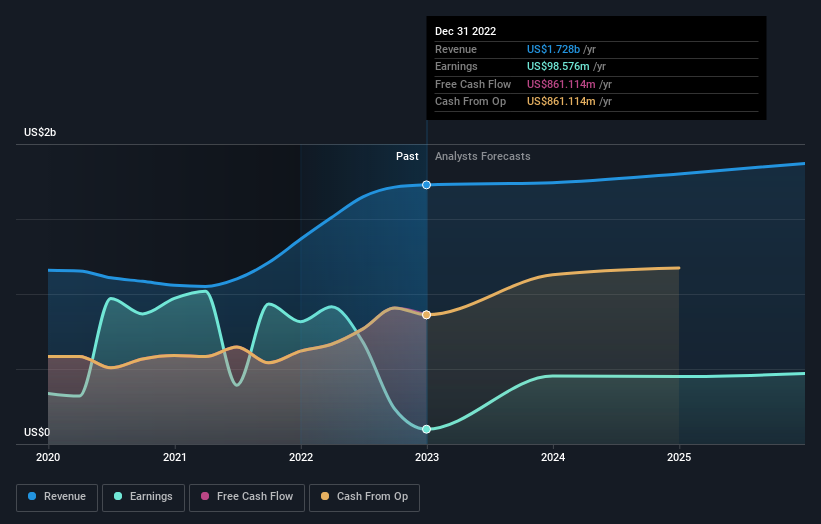
During the three years of share price growth, Kimco Realty actually saw its earnings per share (EPS) drop 42% per year.
This means it's unlikely the market is judging the company based on earnings growth. Since the change in EPS doesn't seem to correlate with the change in share price, it's worth taking a look at other metrics.
The dividend is no better now than it was three years ago, so that is unlikely to have driven the share price higher. It's much more likely that the fact that Kimco Realty has been growing revenue at 18% a year is seen as a genuine positive. It could be that investors are content with the revenue growth on the basis that the company isn't really focussed on profits just yet. And that might explain the higher price.
You can see how earnings and revenue have changed over time in the image below (click on the chart to see the exact values).
You can see how its balance sheet has strengthened (or weakened) over time in this free interactive graphic.
What About Dividends?
When looking at investment returns, it is important to consider the difference between total shareholder return (TSR) and share price return. The TSR incorporates the value of any spin-offs or discounted capital raisings, along with any dividends, based on the assumption that the dividends are reinvested. So for companies that pay a generous dividend, the TSR is often a lot higher than the share price return. We note that for Kimco Realty the TSR over the last 3 years was 107%, which is better than the share price return mentioned above. This is largely a result of its dividend payments!
A Different Perspective
We regret to report that Kimco Realty shareholders are down 19% for the year (even including dividends). Unfortunately, that's worse than the broader market decline of 12%. However, it could simply be that the share price has been impacted by broader market jitters. It might be worth keeping an eye on the fundamentals, in case there's a good opportunity. On the bright side, long term shareholders have made money, with a gain of 11% per year over half a decade. If the fundamental data continues to indicate long term sustainable growth, the current sell-off could be an opportunity worth considering. It's always interesting to track share price performance over the longer term. But to understand Kimco Realty better, we need to consider many other factors. For example, we've discovered 5 warning signs for Kimco Realty (1 can't be ignored!) that you should be aware of before investing here.
Of course Kimco Realty may not be the best stock to buy. So you may wish to see this free collection of growth stocks.
Please note, the market returns quoted in this article reflect the market weighted average returns of stocks that currently trade on American exchanges.
Have feedback on this article? Concerned about the content? Get in touch with us directly. Alternatively, email editorial-team (at) simplywallst.com.
This article by Simply Wall St is general in nature. We provide commentary based on historical data and analyst forecasts only using an unbiased methodology and our articles are not intended to be financial advice. It does not constitute a recommendation to buy or sell any stock, and does not take account of your objectives, or your financial situation. We aim to bring you long-term focused analysis driven by fundamental data. Note that our analysis may not factor in the latest price-sensitive company announcements or qualitative material. Simply Wall St has no position in any stocks mentioned.
Join A Paid User Research Session
You’ll receive a US$30 Amazon Gift card for 1 hour of your time while helping us build better investing tools for the individual investors like yourself. Sign up here
