
 Yahoo Finance
 Despite Its High P/E Ratio, Is Webjet Limited (ASX:WEB) Still Undervalued?

The goal of this article is to teach you how to use price to earnings ratios (P/E ratios). We’ll show how you can use Webjet Limited’s (ASX:WEB) P/E ratio to inform your assessment of the investment opportunity. Webjet has a P/E ratio of 39.3, based on the last twelve months. That corresponds to an earnings yield of approximately 2.5%.
View our latest analysis for Webjet
How Do I Calculate A Price To Earnings Ratio?
The formula for P/E is:
Price to Earnings Ratio = Price per Share ÷ Earnings per Share (EPS)
Or for Webjet:
P/E of 39.3 = A$15.78 ÷ A$0.40 (Based on the trailing twelve months to December 2018.)
Is A High Price-to-Earnings Ratio Good?
A higher P/E ratio implies that investors pay a higher price for the earning power of the business. That isn’t a good or a bad thing on its own, but a high P/E means that buyers have a higher opinion of the business’s prospects, relative to stocks with a lower P/E.
How Growth Rates Impact P/E Ratios
Earnings growth rates have a big influence on P/E ratios. Earnings growth means that in the future the ‘E’ will be higher. That means even if the current P/E is high, it will reduce over time if the share price stays flat. A lower P/E should indicate the stock is cheap relative to others — and that may attract buyers.
It’s great to see that Webjet grew EPS by 19% in the last year. And it has bolstered its earnings per share by 17% per year over the last five years. With that performance, you might expect an above average P/E ratio.
How Does Webjet’s P/E Ratio Compare To Its Peers?
The P/E ratio essentially measures market expectations of a company. The image below shows that Webjet has a higher P/E than the average (29.1) P/E for companies in the online retail industry.
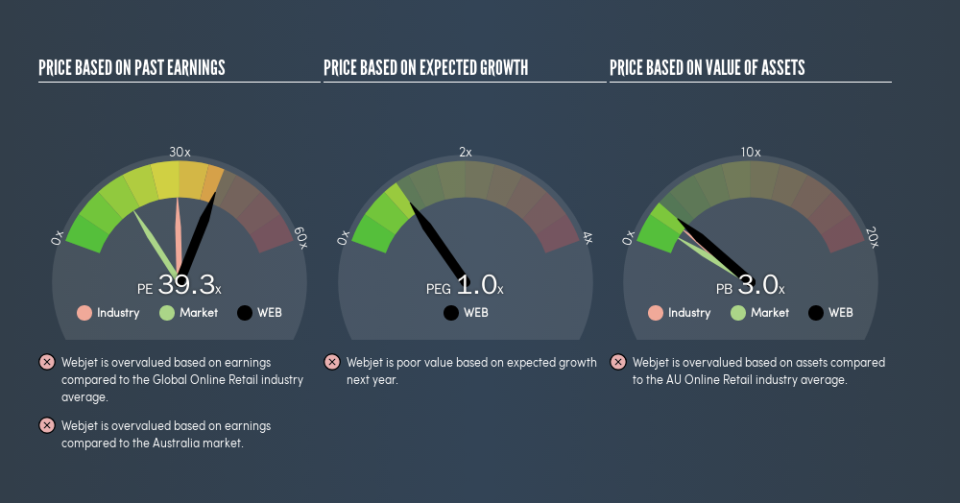
Its relatively high P/E ratio indicates that Webjet shareholders think it will perform better than other companies in its industry classification. Clearly the market expects growth, but it isn’t guaranteed. So investors should delve deeper. I like to check if company insiders have been buying or selling.
A Limitation: P/E Ratios Ignore Debt and Cash In The Bank
The ‘Price’ in P/E reflects the market capitalization of the company. In other words, it does not consider any debt or cash that the company may have on the balance sheet. In theory, a company can lower its future P/E ratio by using cash or debt to invest in growth.
Such expenditure might be good or bad, in the long term, but the point here is that the balance sheet is not reflected by this ratio.
Is Debt Impacting Webjet’s P/E?
Webjet’s net debt is 1.9% of its market cap. So it doesn’t have as many options as it would with net cash, but its debt would not have much of an impact on its P/E ratio.
The Bottom Line On Webjet’s P/E Ratio
Webjet has a P/E of 39.3. That’s higher than the average in the AU market, which is 16.2. The company is not overly constrained by its modest debt levels, and it is growing earnings per share. Therefore it seems reasonable that the market would have relatively high expectations of the company
Investors have an opportunity when market expectations about a stock are wrong. If the reality for a company is better than it expects, you can make money by buying and holding for the long term. So this free report on the analyst consensus forecasts could help you make a master move on this stock.
Of course, you might find a fantastic investment by looking at a few good candidates. So take a peek at this free list of companies with modest (or no) debt, trading on a P/E below 20.
We aim to bring you long-term focused research analysis driven by fundamental data. Note that our analysis may not factor in the latest price-sensitive company announcements or qualitative material.
If you spot an error that warrants correction, please contact the editor at editorial-team@simplywallst.com. This article by Simply Wall St is general in nature. It does not constitute a recommendation to buy or sell any stock, and does not take account of your objectives, or your financial situation. Simply Wall St has no position in the stocks mentioned. Thank you for reading.
