
 Yahoo Finance
 Despite Its High P/E Ratio, Is McMillan Shakespeare Limited (ASX:MMS) Still Undervalued?

Want to participate in a short research study? Help shape the future of investing tools and you could win a $250 gift card!
Today, we'll introduce the concept of the P/E ratio for those who are learning about investing. We'll look at McMillan Shakespeare Limited's (ASX:MMS) P/E ratio and reflect on what it tells us about the company's share price. What is McMillan Shakespeare's P/E ratio? Well, based on the last twelve months it is 23.12. That corresponds to an earnings yield of approximately 4.3%.
See our latest analysis for McMillan Shakespeare
How Do You Calculate A P/E Ratio?
The formula for price to earnings is:
Price to Earnings Ratio = Share Price ÷ Earnings per Share (EPS)
Or for McMillan Shakespeare:
P/E of 23.12 = A$13.96 ÷ A$0.60 (Based on the trailing twelve months to December 2018.)
Is A High P/E Ratio Good?
A higher P/E ratio means that investors are paying a higher price for each A$1 of company earnings. All else being equal, it's better to pay a low price -- but as Warren Buffett said, 'It's far better to buy a wonderful company at a fair price than a fair company at a wonderful price.'
How Growth Rates Impact P/E Ratios
When earnings fall, the 'E' decreases, over time. That means even if the current P/E is low, it will increase over time if the share price stays flat. A higher P/E should indicate the stock is expensive relative to others -- and that may encourage shareholders to sell.
McMillan Shakespeare's earnings per share fell by 20% in the last twelve months. And it has shrunk its earnings per share by 2.7% per year over the last five years. This could justify a pessimistic P/E.
How Does McMillan Shakespeare's P/E Ratio Compare To Its Peers?
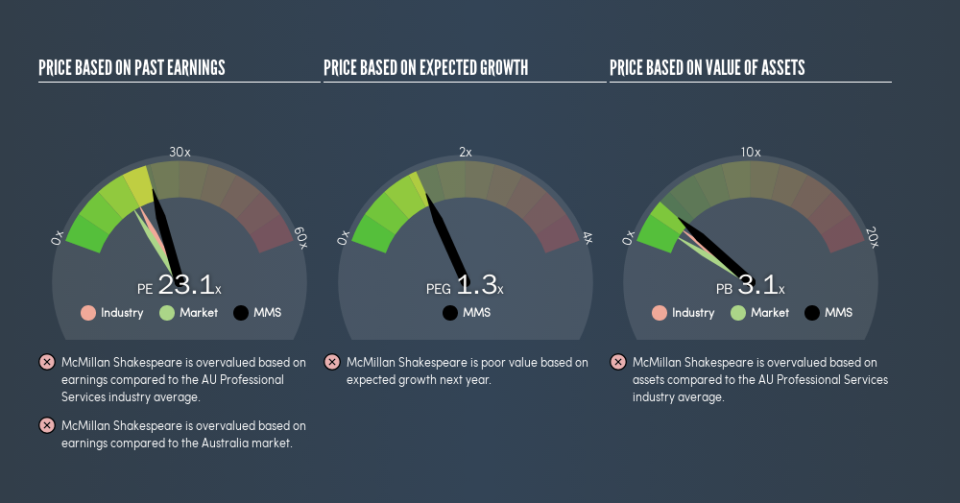
One good way to get a quick read on what market participants expect of a company is to look at its P/E ratio. The image below shows that McMillan Shakespeare has a higher P/E than the average (18.2) P/E for companies in the professional services industry.
Its relatively high P/E ratio indicates that McMillan Shakespeare shareholders think it will perform better than other companies in its industry classification. The market is optimistic about the future, but that doesn't guarantee future growth. So investors should delve deeper. I like to check if company insiders have been buying or selling.
A Limitation: P/E Ratios Ignore Debt and Cash In The Bank
The 'Price' in P/E reflects the market capitalization of the company. Thus, the metric does not reflect cash or debt held by the company. In theory, a company can lower its future P/E ratio by using cash or debt to invest in growth.
Such expenditure might be good or bad, in the long term, but the point here is that the balance sheet is not reflected by this ratio.
McMillan Shakespeare's Balance Sheet
McMillan Shakespeare's net debt is 22% of its market cap. This could bring some additional risk, and reduce the number of investment options for management; worth remembering if you compare its P/E to businesses without debt.
The Verdict On McMillan Shakespeare's P/E Ratio
McMillan Shakespeare's P/E is 23.1 which is above average (16.2) in the AU market. With a bit of debt, but a lack of recent growth, it's safe to say the market is expecting improved profit performance from the company, in the next few years.
Investors should be looking to buy stocks that the market is wrong about. If the reality for a company is better than it expects, you can make money by buying and holding for the long term. So this free visualization of the analyst consensus on future earnings could help you make the right decision about whether to buy, sell, or hold.
You might be able to find a better buy than McMillan Shakespeare. If you want a selection of possible winners, check out this free list of interesting companies that trade on a P/E below 20 (but have proven they can grow earnings).
We aim to bring you long-term focused research analysis driven by fundamental data. Note that our analysis may not factor in the latest price-sensitive company announcements or qualitative material.
If you spot an error that warrants correction, please contact the editor at editorial-team@simplywallst.com. This article by Simply Wall St is general in nature. It does not constitute a recommendation to buy or sell any stock, and does not take account of your objectives, or your financial situation. Simply Wall St has no position in the stocks mentioned. Thank you for reading.
