
 Yahoo Finance
 Despite Its High P/E Ratio, Is McMillan Shakespeare Limited (ASX:MMS) Still Undervalued?

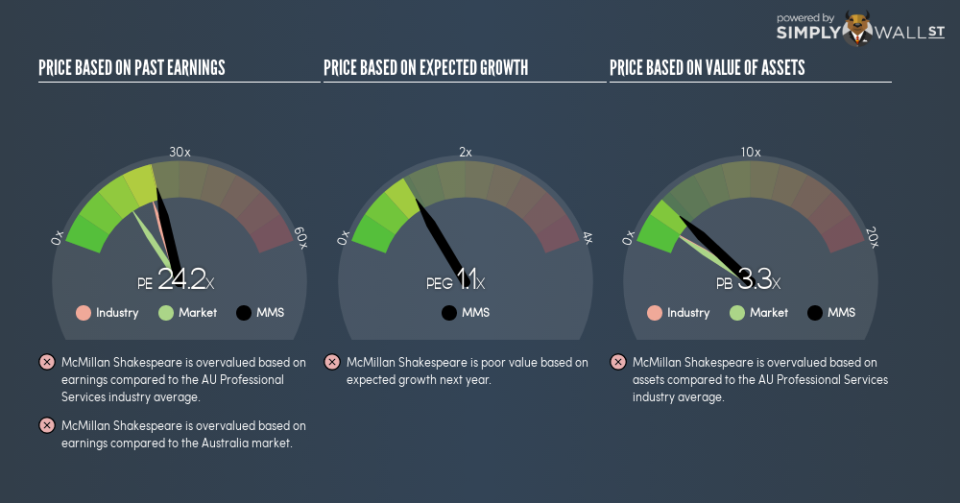
This article is for investors who would like to improve their understanding of price to earnings ratios (P/E ratios). We’ll show how you can use McMillan Shakespeare Limited’s (ASX:MMS) P/E ratio to inform your assessment of the investment opportunity. McMillan Shakespeare has a price to earnings ratio of 24.24, based on the last twelve months. In other words, at today’s prices, investors are paying A$24.24 for every A$1 in prior year profit.
See our latest analysis for McMillan Shakespeare
How Do You Calculate A P/E Ratio?
The formula for P/E is:
Price to Earnings Ratio = Share Price ÷ Earnings per Share (EPS)
Or for McMillan Shakespeare:
P/E of 24.24 = A$14.76 ÷ A$0.61 (Based on the trailing twelve months to June 2018.)
Is A High P/E Ratio Good?
A higher P/E ratio means that investors are paying a higher price for each A$1 of company earnings. All else being equal, it’s better to pay a low price — but as Warren Buffett said, ‘It’s far better to buy a wonderful company at a fair price than a fair company at a wonderful price.’
How Growth Rates Impact P/E Ratios
When earnings fall, the ‘E’ decreases, over time. That means unless the share price falls, the P/E will increase in a few years. Then, a higher P/E might scare off shareholders, pushing the share price down.
McMillan Shakespeare saw earnings per share decrease by 25% last year. And over the longer term (3 years) earnings per share have decreased 11% annually. This could justify a low P/E.
How Does McMillan Shakespeare’s P/E Ratio Compare To Its Peers?
We can get an indication of market expectations by looking at the P/E ratio. As you can see below, McMillan Shakespeare has a higher P/E than the average company (22.2) in the professional services industry.
McMillan Shakespeare’s P/E tells us that market participants think the company will perform better than its industry peers, going forward. Clearly the market expects growth, but it isn’t guaranteed. So investors should delve deeper. I like to check if company insiders have been buying or selling.
Remember: P/E Ratios Don’t Consider The Balance Sheet
The ‘Price’ in P/E reflects the market capitalization of the company. That means it doesn’t take debt or cash into account. Hypothetically, a company could reduce its future P/E ratio by spending its cash (or taking on debt) to achieve higher earnings.
Such expenditure might be good or bad, in the long term, but the point here is that the balance sheet is not reflected by this ratio.
How Does McMillan Shakespeare’s Debt Impact Its P/E Ratio?
Net debt totals 19% of McMillan Shakespeare’s market cap. That’s enough debt to impact the P/E ratio a little; so keep it in mind if you’re comparing it to companies without debt.
The Bottom Line On McMillan Shakespeare’s P/E Ratio
McMillan Shakespeare’s P/E is 24.2 which is above average (15.8) in the AU market. With a bit of debt, but a lack of recent growth, it’s safe to say the market is expecting improved profit performance from the company, in the next few years.
Investors should be looking to buy stocks that the market is wrong about. If the reality for a company is better than it expects, you can make money by buying and holding for the long term. So this free report on the analyst consensus forecasts could help you make a master move on this stock.
Of course you might be able to find a better stock than McMillan Shakespeare. So you may wish to see this free collection of other companies that have grown earnings strongly.
To help readers see past the short term volatility of the financial market, we aim to bring you a long-term focused research analysis purely driven by fundamental data. Note that our analysis does not factor in the latest price-sensitive company announcements.
The author is an independent contributor and at the time of publication had no position in the stocks mentioned. For errors that warrant correction please contact the editor at editorial-team@simplywallst.com.
