
 Yahoo Finance
 Dermapharm Holding (ETR:DMP) shareholders have earned a 11% CAGR over the last five years
When we invest, we're generally looking for stocks that outperform the market average. And in our experience, buying the right stocks can give your wealth a significant boost. To wit, the Dermapharm Holding share price has climbed 46% in five years, easily topping the market decline of 7.4% (ignoring dividends).
With that in mind, it's worth seeing if the company's underlying fundamentals have been the driver of long term performance, or if there are some discrepancies.
Check out our latest analysis for Dermapharm Holding
To paraphrase Benjamin Graham: Over the short term the market is a voting machine, but over the long term it's a weighing machine. By comparing earnings per share (EPS) and share price changes over time, we can get a feel for how investor attitudes to a company have morphed over time.
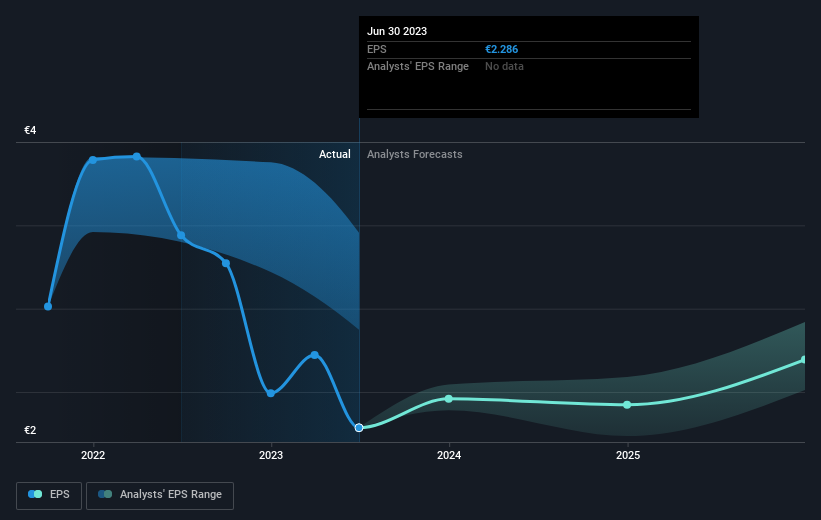
During five years of share price growth, Dermapharm Holding achieved compound earnings per share (EPS) growth of 8.9% per year. So the EPS growth rate is rather close to the annualized share price gain of 8% per year. Therefore one could conclude that sentiment towards the shares hasn't morphed very much. Rather, the share price has approximately tracked EPS growth.
You can see below how EPS has changed over time (discover the exact values by clicking on the image).
Before buying or selling a stock, we always recommend a close examination of historic growth trends, available here.
What About Dividends?
It is important to consider the total shareholder return, as well as the share price return, for any given stock. The TSR is a return calculation that accounts for the value of cash dividends (assuming that any dividend received was reinvested) and the calculated value of any discounted capital raisings and spin-offs. It's fair to say that the TSR gives a more complete picture for stocks that pay a dividend. In the case of Dermapharm Holding, it has a TSR of 66% for the last 5 years. That exceeds its share price return that we previously mentioned. This is largely a result of its dividend payments!
A Different Perspective
Dermapharm Holding shareholders are down 0.7% for the year (even including dividends), but the market itself is up 15%. Even the share prices of good stocks drop sometimes, but we want to see improvements in the fundamental metrics of a business, before getting too interested. Longer term investors wouldn't be so upset, since they would have made 11%, each year, over five years. It could be that the recent sell-off is an opportunity, so it may be worth checking the fundamental data for signs of a long term growth trend. While it is well worth considering the different impacts that market conditions can have on the share price, there are other factors that are even more important. Consider risks, for instance. Every company has them, and we've spotted 3 warning signs for Dermapharm Holding you should know about.
Of course Dermapharm Holding may not be the best stock to buy. So you may wish to see this free collection of growth stocks.
Please note, the market returns quoted in this article reflect the market weighted average returns of stocks that currently trade on German exchanges.
Have feedback on this article? Concerned about the content? Get in touch with us directly. Alternatively, email editorial-team (at) simplywallst.com.
This article by Simply Wall St is general in nature. We provide commentary based on historical data and analyst forecasts only using an unbiased methodology and our articles are not intended to be financial advice. It does not constitute a recommendation to buy or sell any stock, and does not take account of your objectives, or your financial situation. We aim to bring you long-term focused analysis driven by fundamental data. Note that our analysis may not factor in the latest price-sensitive company announcements or qualitative material. Simply Wall St has no position in any stocks mentioned.
