
 Yahoo Finance
 Do You Like Delek US Holdings, Inc. (NYSE:DK) At This P/E Ratio?

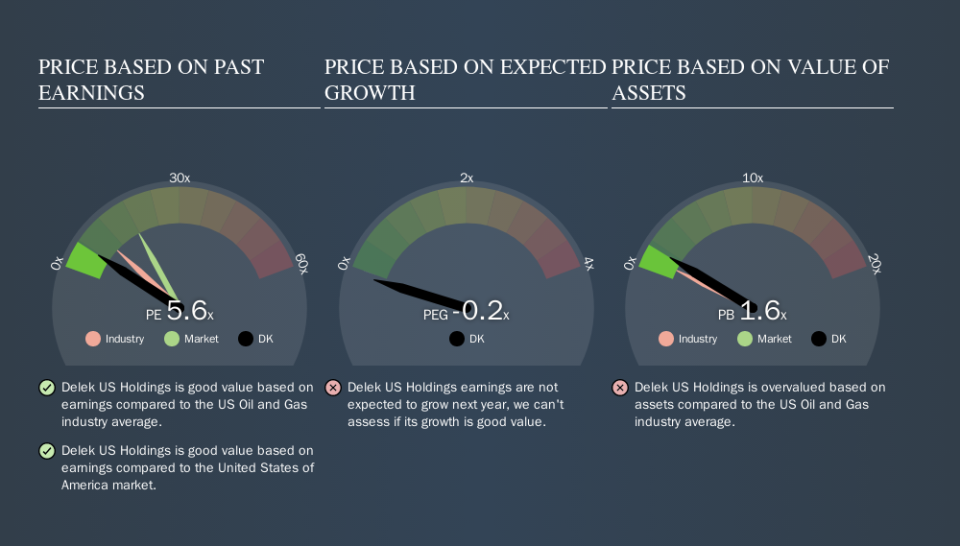
This article is for investors who would like to improve their understanding of price to earnings ratios (P/E ratios). To keep it practical, we'll show how Delek US Holdings, Inc.'s (NYSE:DK) P/E ratio could help you assess the value on offer. Delek US Holdings has a price to earnings ratio of 5.61, based on the last twelve months. That is equivalent to an earnings yield of about 17.8%.
See our latest analysis for Delek US Holdings
How Do You Calculate A P/E Ratio?
The formula for P/E is:
Price to Earnings Ratio = Price per Share ÷ Earnings per Share (EPS)
Or for Delek US Holdings:
P/E of 5.61 = $37.16 ÷ $6.62 (Based on the trailing twelve months to June 2019.)
Is A High Price-to-Earnings Ratio Good?
A higher P/E ratio means that investors are paying a higher price for each $1 of company earnings. That isn't a good or a bad thing on its own, but a high P/E means that buyers have a higher opinion of the business's prospects, relative to stocks with a lower P/E.
How Does Delek US Holdings's P/E Ratio Compare To Its Peers?
We can get an indication of market expectations by looking at the P/E ratio. If you look at the image below, you can see Delek US Holdings has a lower P/E than the average (9.7) in the oil and gas industry classification.
This suggests that market participants think Delek US Holdings will underperform other companies in its industry. Many investors like to buy stocks when the market is pessimistic about their prospects. It is arguably worth checking if insiders are buying shares, because that might imply they believe the stock is undervalued.
How Growth Rates Impact P/E Ratios
Earnings growth rates have a big influence on P/E ratios. When earnings grow, the 'E' increases, over time. That means even if the current P/E is high, it will reduce over time if the share price stays flat. So while a stock may look expensive based on past earnings, it could be cheap based on future earnings.
Notably, Delek US Holdings grew EPS by a whopping 47% in the last year. And earnings per share have improved by 37% annually, over the last five years. So we'd generally expect it to have a relatively high P/E ratio.
Don't Forget: The P/E Does Not Account For Debt or Bank Deposits
One drawback of using a P/E ratio is that it considers market capitalization, but not the balance sheet. Thus, the metric does not reflect cash or debt held by the company. The exact same company would hypothetically deserve a higher P/E ratio if it had a strong balance sheet, than if it had a weak one with lots of debt, because a cashed up company can spend on growth.
Such spending might be good or bad, overall, but the key point here is that you need to look at debt to understand the P/E ratio in context.
Is Debt Impacting Delek US Holdings's P/E?
Delek US Holdings has net debt equal to 35% of its market cap. While that's enough to warrant consideration, it doesn't really concern us.
The Bottom Line On Delek US Holdings's P/E Ratio
Delek US Holdings's P/E is 5.6 which is below average (18.0) in the US market. The EPS growth last year was strong, and debt levels are quite reasonable. If the company can continue to grow earnings, then the current P/E may be unjustifiably low.
Investors should be looking to buy stocks that the market is wrong about. If it is underestimating a company, investors can make money by buying and holding the shares until the market corrects itself. So this free visualization of the analyst consensus on future earnings could help you make the right decision about whether to buy, sell, or hold.
But note: Delek US Holdings may not be the best stock to buy. So take a peek at this free list of interesting companies with strong recent earnings growth (and a P/E ratio below 20).
We aim to bring you long-term focused research analysis driven by fundamental data. Note that our analysis may not factor in the latest price-sensitive company announcements or qualitative material.
If you spot an error that warrants correction, please contact the editor at editorial-team@simplywallst.com. This article by Simply Wall St is general in nature. It does not constitute a recommendation to buy or sell any stock, and does not take account of your objectives, or your financial situation. Simply Wall St has no position in the stocks mentioned. Thank you for reading.
