
 Yahoo Finance
 Decmil Group (ASX:DCG) Is Doing The Right Things To Multiply Its Share Price
What trends should we look for it we want to identify stocks that can multiply in value over the long term? Firstly, we'll want to see a proven return on capital employed (ROCE) that is increasing, and secondly, an expanding base of capital employed. Put simply, these types of businesses are compounding machines, meaning they are continually reinvesting their earnings at ever-higher rates of return. So on that note, Decmil Group (ASX:DCG) looks quite promising in regards to its trends of return on capital.
What Is Return On Capital Employed (ROCE)?
If you haven't worked with ROCE before, it measures the 'return' (pre-tax profit) a company generates from capital employed in its business. Analysts use this formula to calculate it for Decmil Group:
Return on Capital Employed = Earnings Before Interest and Tax (EBIT) ÷ (Total Assets - Current Liabilities)
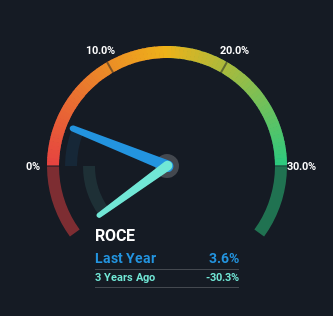
0.036 = AU$3.4m ÷ (AU$209m - AU$115m) (Based on the trailing twelve months to June 2023).
Thus, Decmil Group has an ROCE of 3.6%. Ultimately, that's a low return and it under-performs the Construction industry average of 13%.
Check out our latest analysis for Decmil Group
While the past is not representative of the future, it can be helpful to know how a company has performed historically, which is why we have this chart above. If you're interested in investigating Decmil Group's past further, check out this free graph of past earnings, revenue and cash flow.
How Are Returns Trending?
While the ROCE is still rather low for Decmil Group, we're glad to see it heading in the right direction. The figures show that over the last five years, returns on capital have grown by 315%. The company is now earning AU$0.04 per dollar of capital employed. Speaking of capital employed, the company is actually utilizing 55% less than it was five years ago, which can be indicative of a business that's improving its efficiency. If this trend continues, the business might be getting more efficient but it's shrinking in terms of total assets.
On a side note, we noticed that the improvement in ROCE appears to be partly fueled by an increase in current liabilities. Effectively this means that suppliers or short-term creditors are now funding 55% of the business, which is more than it was five years ago. Given it's pretty high ratio, we'd remind investors that having current liabilities at those levels can bring about some risks in certain businesses.
The Bottom Line
From what we've seen above, Decmil Group has managed to increase it's returns on capital all the while reducing it's capital base. However the stock is down a substantial 98% in the last five years so there could be other areas of the business hurting its prospects. Still, it's worth doing some further research to see if the trends will continue into the future.
Since virtually every company faces some risks, it's worth knowing what they are, and we've spotted 3 warning signs for Decmil Group (of which 2 are concerning!) that you should know about.
For those who like to invest in solid companies, check out this free list of companies with solid balance sheets and high returns on equity.
Have feedback on this article? Concerned about the content? Get in touch with us directly. Alternatively, email editorial-team (at) simplywallst.com.
This article by Simply Wall St is general in nature. We provide commentary based on historical data and analyst forecasts only using an unbiased methodology and our articles are not intended to be financial advice. It does not constitute a recommendation to buy or sell any stock, and does not take account of your objectives, or your financial situation. We aim to bring you long-term focused analysis driven by fundamental data. Note that our analysis may not factor in the latest price-sensitive company announcements or qualitative material. Simply Wall St has no position in any stocks mentioned.
