
 Yahoo Finance
 Declining Stock and Decent Financials: Is The Market Wrong About SpartanNash Company (NASDAQ:SPTN)?
With its stock down 6.0% over the past three months, it is easy to disregard SpartanNash (NASDAQ:SPTN). However, the company's fundamentals look pretty decent, and long-term financials are usually aligned with future market price movements. Specifically, we decided to study SpartanNash's ROE in this article.
Return on equity or ROE is a key measure used to assess how efficiently a company's management is utilizing the company's capital. In simpler terms, it measures the profitability of a company in relation to shareholder's equity.
See our latest analysis for SpartanNash
How Is ROE Calculated?
The formula for return on equity is:
Return on Equity = Net Profit (from continuing operations) ÷ Shareholders' Equity
So, based on the above formula, the ROE for SpartanNash is:
7.8% = US$62m ÷ US$794m (Based on the trailing twelve months to July 2022).
The 'return' refers to a company's earnings over the last year. One way to conceptualize this is that for each $1 of shareholders' capital it has, the company made $0.08 in profit.
What Is The Relationship Between ROE And Earnings Growth?
Thus far, we have learned that ROE measures how efficiently a company is generating its profits. We now need to evaluate how much profit the company reinvests or "retains" for future growth which then gives us an idea about the growth potential of the company. Assuming all else is equal, companies that have both a higher return on equity and higher profit retention are usually the ones that have a higher growth rate when compared to companies that don't have the same features.
A Side By Side comparison of SpartanNash's Earnings Growth And 7.8% ROE
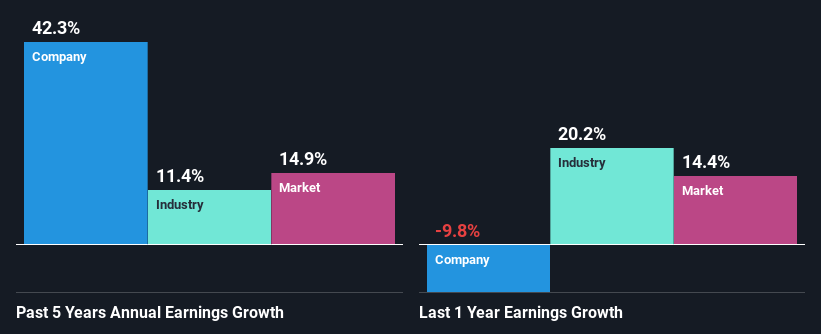
On the face of it, SpartanNash's ROE is not much to talk about. A quick further study shows that the company's ROE doesn't compare favorably to the industry average of 14% either. In spite of this, SpartanNash was able to grow its net income considerably, at a rate of 42% in the last five years. Therefore, there could be other reasons behind this growth. For instance, the company has a low payout ratio or is being managed efficiently.
As a next step, we compared SpartanNash's net income growth with the industry, and pleasingly, we found that the growth seen by the company is higher than the average industry growth of 11%.
Earnings growth is a huge factor in stock valuation. The investor should try to establish if the expected growth or decline in earnings, whichever the case may be, is priced in. This then helps them determine if the stock is placed for a bright or bleak future. If you're wondering about SpartanNash's's valuation, check out this gauge of its price-to-earnings ratio, as compared to its industry.
Is SpartanNash Using Its Retained Earnings Effectively?
SpartanNash has a three-year median payout ratio of 40% (where it is retaining 60% of its income) which is not too low or not too high. So it seems that SpartanNash is reinvesting efficiently in a way that it sees impressive growth in its earnings (discussed above) and pays a dividend that's well covered.
Additionally, SpartanNash has paid dividends over a period of at least ten years which means that the company is pretty serious about sharing its profits with shareholders. Our latest analyst data shows that the future payout ratio of the company is expected to drop to 30% over the next three years. The fact that the company's ROE is expected to rise to 9.8% over the same period is explained by the drop in the payout ratio.
Conclusion
In total, it does look like SpartanNash has some positive aspects to its business. With a high rate of reinvestment, albeit at a low ROE, the company has managed to see a considerable growth in its earnings. That being so, a study of the latest analyst forecasts show that the company is expected to see a slowdown in its future earnings growth. Are these analysts expectations based on the broad expectations for the industry, or on the company's fundamentals? Click here to be taken to our analyst's forecasts page for the company.
Have feedback on this article? Concerned about the content? Get in touch with us directly. Alternatively, email editorial-team (at) simplywallst.com.
This article by Simply Wall St is general in nature. We provide commentary based on historical data and analyst forecasts only using an unbiased methodology and our articles are not intended to be financial advice. It does not constitute a recommendation to buy or sell any stock, and does not take account of your objectives, or your financial situation. We aim to bring you long-term focused analysis driven by fundamental data. Note that our analysis may not factor in the latest price-sensitive company announcements or qualitative material. Simply Wall St has no position in any stocks mentioned.
Join A Paid User Research Session
You’ll receive a US$30 Amazon Gift card for 1 hour of your time while helping us build better investing tools for the individual investors like yourself. Sign up here
