
 Yahoo Finance
 What Is Data#3's (ASX:DTL) P/E Ratio After Its Share Price Rocketed?

It's really great to see that even after a strong run, Data#3 (ASX:DTL) shares have been powering on, with a gain of 33% in the last thirty days. That's tops off a massive gain of 133% in the last year.
All else being equal, a sharp share price increase should make a stock less attractive to potential investors. In the long term, share prices tend to follow earnings per share, but in the short term prices bounce around in response to short term factors (which are not always obvious). The implication here is that deep value investors might steer clear when expectations of a company are too high. Perhaps the simplest way to get a read on investors' expectations of a business is to look at its Price to Earnings Ratio (PE Ratio). Investors have optimistic expectations of companies with higher P/E ratios, compared to companies with lower P/E ratios.
See our latest analysis for Data#3
Does Data#3 Have A Relatively High Or Low P/E For Its Industry?
Data#3's P/E of 30.35 indicates some degree of optimism towards the stock. As you can see below, Data#3 has a higher P/E than the average company (22.3) in the it industry.
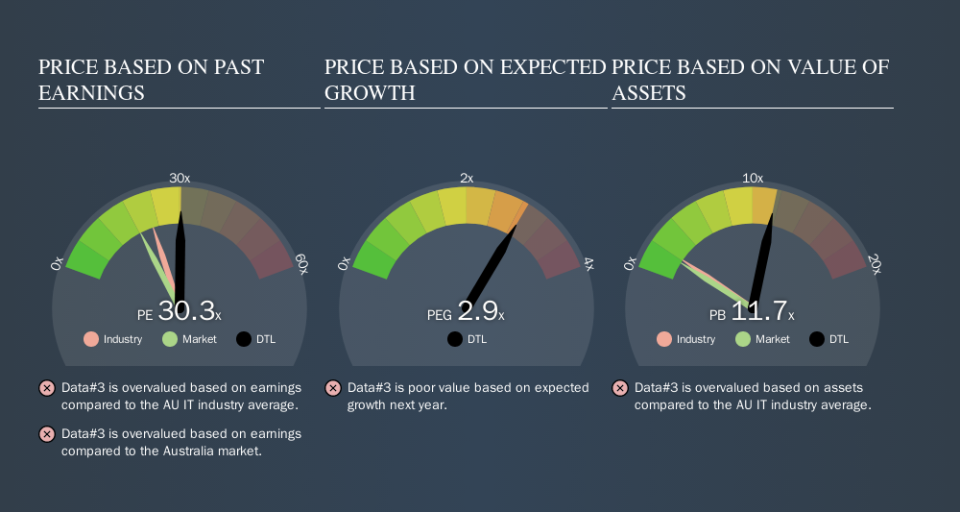
Data#3's P/E tells us that market participants think the company will perform better than its industry peers, going forward. The market is optimistic about the future, but that doesn't guarantee future growth. So investors should always consider the P/E ratio alongside other factors, such as whether company directors have been buying shares.
How Growth Rates Impact P/E Ratios
Probably the most important factor in determining what P/E a company trades on is the earnings growth. Earnings growth means that in the future the 'E' will be higher. That means unless the share price increases, the P/E will reduce in a few years. Then, a lower P/E should attract more buyers, pushing the share price up.
It's nice to see that Data#3 grew EPS by a stonking 29% in the last year. And its annual EPS growth rate over 5 years is 19%. So we'd generally expect it to have a relatively high P/E ratio.
A Limitation: P/E Ratios Ignore Debt and Cash In The Bank
It's important to note that the P/E ratio considers the market capitalization, not the enterprise value. Thus, the metric does not reflect cash or debt held by the company. Theoretically, a business can improve its earnings (and produce a lower P/E in the future) by investing in growth. That means taking on debt (or spending its cash).
Such spending might be good or bad, overall, but the key point here is that you need to look at debt to understand the P/E ratio in context.
Data#3's Balance Sheet
With net cash of AU$121m, Data#3 has a very strong balance sheet, which may be important for its business. Having said that, at 22% of its market capitalization the cash hoard would contribute towards a higher P/E ratio.
The Bottom Line On Data#3's P/E Ratio
Data#3 trades on a P/E ratio of 30.3, which is above its market average of 18.3. With cash in the bank the company has plenty of growth options -- and it is already on the right track. Therefore it seems reasonable that the market would have relatively high expectations of the company What we know for sure is that investors have become much more excited about Data#3 recently, since they have pushed its P/E ratio from 22.8 to 30.3 over the last month. For those who prefer to invest with the flow of momentum, that might mean it's time to put the stock on a watchlist, or research it. But the contrarian may see it as a missed opportunity.
Investors should be looking to buy stocks that the market is wrong about. As value investor Benjamin Graham famously said, 'In the short run, the market is a voting machine but in the long run, it is a weighing machine. So this free visualization of the analyst consensus on future earnings could help you make the right decision about whether to buy, sell, or hold.
You might be able to find a better buy than Data#3. If you want a selection of possible winners, check out this free list of interesting companies that trade on a P/E below 20 (but have proven they can grow earnings).
We aim to bring you long-term focused research analysis driven by fundamental data. Note that our analysis may not factor in the latest price-sensitive company announcements or qualitative material.
If you spot an error that warrants correction, please contact the editor at editorial-team@simplywallst.com. This article by Simply Wall St is general in nature. It does not constitute a recommendation to buy or sell any stock, and does not take account of your objectives, or your financial situation. Simply Wall St has no position in the stocks mentioned. Thank you for reading.
