
 Yahoo Finance
 D.R. Horton's (NYSE:DHI) investors will be pleased with their solid 202% return over the last five years
It might be of some concern to shareholders to see the D.R. Horton, Inc. (NYSE:DHI) share price down 13% in the last month. But that doesn't change the fact that the returns over the last five years have been very strong. Indeed, the share price is up an impressive 184% in that time. Generally speaking the long term returns will give you a better idea of business quality than short periods can. Ultimately business performance will determine whether the stock price continues the positive long term trend.
With that in mind, it's worth seeing if the company's underlying fundamentals have been the driver of long term performance, or if there are some discrepancies.
View our latest analysis for D.R. Horton
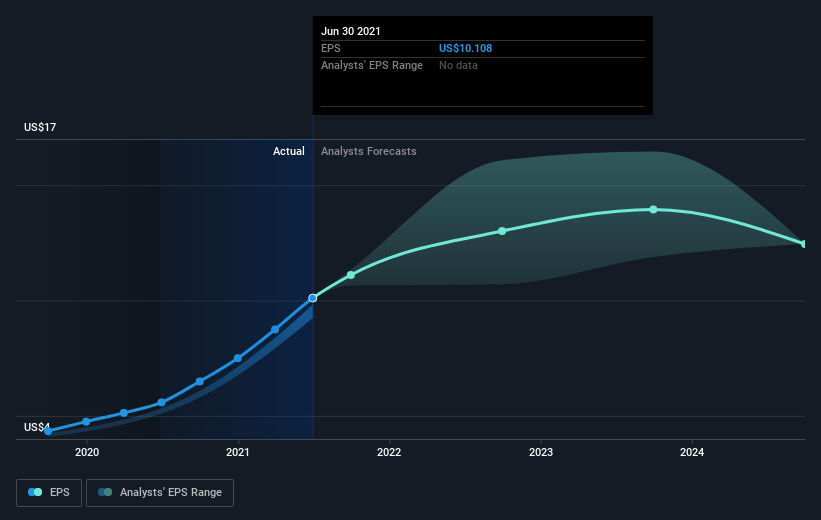
While markets are a powerful pricing mechanism, share prices reflect investor sentiment, not just underlying business performance. One flawed but reasonable way to assess how sentiment around a company has changed is to compare the earnings per share (EPS) with the share price.
Over half a decade, D.R. Horton managed to grow its earnings per share at 35% a year. The EPS growth is more impressive than the yearly share price gain of 23% over the same period. So one could conclude that the broader market has become more cautious towards the stock. This cautious sentiment is reflected in its (fairly low) P/E ratio of 8.11.
You can see how EPS has changed over time in the image below (click on the chart to see the exact values).
We know that D.R. Horton has improved its bottom line over the last three years, but what does the future have in store? Take a more thorough look at D.R. Horton's financial health with this free report on its balance sheet.
What About Dividends?
As well as measuring the share price return, investors should also consider the total shareholder return (TSR). The TSR is a return calculation that accounts for the value of cash dividends (assuming that any dividend received was reinvested) and the calculated value of any discounted capital raisings and spin-offs. So for companies that pay a generous dividend, the TSR is often a lot higher than the share price return. In the case of D.R. Horton, it has a TSR of 202% for the last 5 years. That exceeds its share price return that we previously mentioned. And there's no prize for guessing that the dividend payments largely explain the divergence!
A Different Perspective
D.R. Horton shareholders gained a total return of 11% during the year. But that was short of the market average. If we look back over five years, the returns are even better, coming in at 25% per year for five years. It may well be that this is a business worth popping on the watching, given the continuing positive reception, over time, from the market. It's always interesting to track share price performance over the longer term. But to understand D.R. Horton better, we need to consider many other factors. For instance, we've identified 2 warning signs for D.R. Horton (1 is a bit concerning) that you should be aware of.
For those who like to find winning investments this free list of growing companies with recent insider purchasing, could be just the ticket.
Please note, the market returns quoted in this article reflect the market weighted average returns of stocks that currently trade on US exchanges.
This article by Simply Wall St is general in nature. We provide commentary based on historical data and analyst forecasts only using an unbiased methodology and our articles are not intended to be financial advice. It does not constitute a recommendation to buy or sell any stock, and does not take account of your objectives, or your financial situation. We aim to bring you long-term focused analysis driven by fundamental data. Note that our analysis may not factor in the latest price-sensitive company announcements or qualitative material. Simply Wall St has no position in any stocks mentioned.
Have feedback on this article? Concerned about the content? Get in touch with us directly. Alternatively, email editorial-team (at) simplywallst.com.
