
 Yahoo Finance
 Crude Oil Price Update – Without Bullish Catalyst Likely to See Retest of $57.79-$55.99
U.S. West Texas Intermediate crude oil futures closed slightly better on Friday in a mostly lackluster trade. Traders blamed sluggish economic growth in China, the world’s biggest crude importer, for putting a lid on gains. The renewed concerns over fuel demand offset optimism from the signing of Phase One of the U.S.-China trade deal and a bigger than expected draw down in weekly government inventories.
On Friday, March WTI crude oil settled at $58.58, up $0.05 or +0.09%.
Daily Swing Chart Technical Analysis
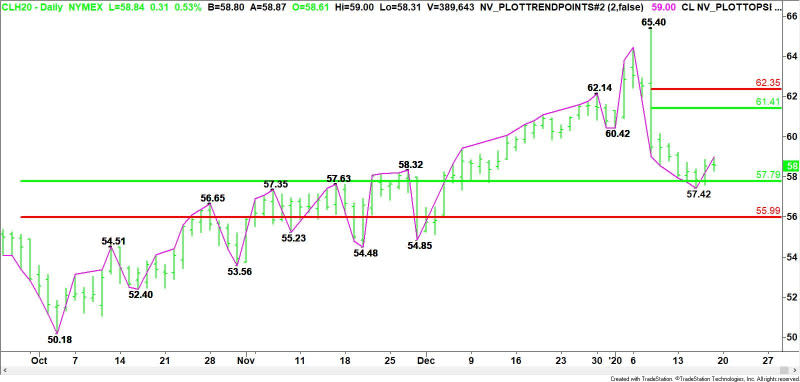
The main trend is down according to the daily swing chart. The two-day rally at the end of the week turned $57.42 into a new main bottom. A trade through this bottom will reaffirm the downtrend. The main trend will change to up on a move through $65.40. This is highly unlikely, but there is room for a normal 50% to 61.8% retracement.
The main range is $50.18 to $65.40. Its retracement zone at $57.79 to $55.99 is a potentially major support zone. It stopped the selling at $57.42 on January 15.
The new short-term range is $65.40 to $57.42. Its retracement zone at $61.41 to $62.35 is a potential upside target.
Daily Swing Chart Technical Forecast
The chart pattern is pretty clear. Value-seeking buyers have to continue to come in at $57.79 to $55.99 to defend against a steep sell-off. If successful, we could see an eventual move into the short-term retracement zone at $61.41 to $62.35.
Usually, the first break from a high is fueled by long liquidation. The second break is fueled by actual short-sellers, following a retracement of the first leg down. If this is the pattern, then we expect to see a move to $61.41 to $62.35.
The problem is this type of rally is usually fueled by a catalyst. With the de-escalation of tensions in the Middle East, finding a catalyst could be difficult.
If the selling pressure resumes then look for a retest of $57.79 to $55.99. Aggressive counter-trend buyers could try to build a support base inside this zone.
This article was originally posted on FX Empire
More From FXEMPIRE:
The Week Ahead: Monetary Policy in Focus, with the PBoC, BoJ, BoC, and the ECB in Action
E-mini NASDAQ-100 Index (NQ) Futures Technical Analysis – Trader Reaction to 9174.50 Sets Tone
EOS, Ethereum and Ripple’s XRP – Daily Tech Analysis – 19/01/20
USD/JPY Forex Technical Analysis – In Window of Time for Closing Price Reversal Top
Gold Price Futures (GC) Technical Analysis – Momentum Shifts to Upside on Trade Through $1564.20
