
 Yahoo Finance
 Crude Oil, Gold and SPX 500 Marking Time in Trading Ranges
DailyFX.com -
Talking Points:
US Dollar Advances to the Strongest Level in Three Weeks
S&P 500 Remains in Digestion Mode Below Record High
Gold, Crude Oil Prices Still Waiting for Direction Trigger
Can’t access the Dow Jones FXCM US Dollar Index? Try the USD basket on Mirror Trader. **
US DOLLAR TECHNICAL ANALYSIS – Prices accelerated upward, advancing to the highest level in three weeks. Near-term resistance is at 11898, the 50% Fibonacci retracement, with a break above that on a daily closing basis exposing the 61.8% level at 11960. Alternatively, a turn back below the 38.2% Fib at 11836 clears the way for a test of the 23.6% retracement at 11759.
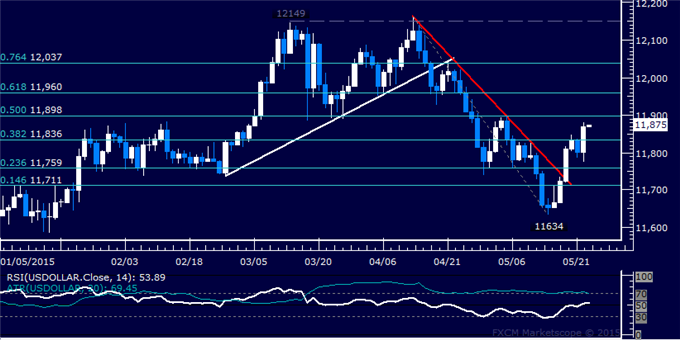
Daily Chart - Created Using FXCM Marketscope
** The Dow Jones FXCM US Dollar Index and the Mirror Trader USD basket are not the same product.
S&P 500 TECHNICAL ANALYSIS – Prices are consolidating after breaking range resistance and setting a new record high. From here, a daily close above the 50% Fibonacci expansion at 2140.70 exposes the 61.8% level at 2159.30. Alternatively, a move back below the 38.2% Fib at 2122.10 targets the 23.6% expansion at 2099.10.
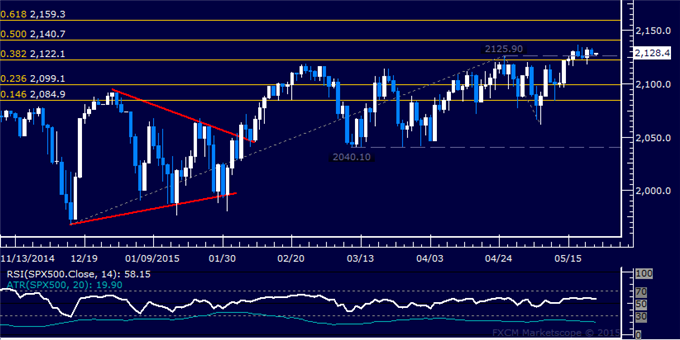
Daily Chart - Created Using FXCM Marketscope
GOLD TECHNICAL ANALYSIS – Prices continue to consolidate after recoiling from resistance below $1250.oz. A close below trend line resistance-turned-support at 1204.19 exposes the 23.6% Fibonacci expansion at 1193.38. Near-term resistance is at 1232.30, the May 18 high.

Daily Chart - Created Using FXCM Marketscope
CRUDE OIL TECHNICAL ANALYSIS – Prices remain locked in a choppy consolidation range below the $70/barrel figure. A daily close below the 23.6% Fibonacci retracement exposes the 38.2% level at 60.27. Alternatively, a move above trend line resistance at 67.68 targets the 23.6% Fib expansion at 69.70.
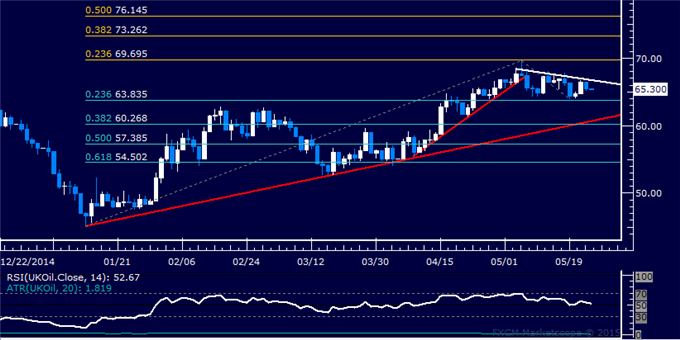
Daily Chart - Created Using FXCM Marketscope
--- Written by Ilya Spivak, Currency Strategist for DailyFX.com
To receive Ilya's analysis directly via email, please SIGN UP HERE
Contact and follow Ilya on Twitter: @IlyaSpivak
DailyFX provides forex news and technical analysis on the trends that influence the global currency markets.
Learn forex trading with a free practice account and trading charts from FXCM.