
 Yahoo Finance
 Crude Oil forecast for the week of October 23, 2017, Technical Analysis
WTI Crude Oil
The WTI Crude Oil market initially dipped during the week, but then reached towards the $52.50 level above. This is an area that has been resistive in the past, so if we were to break above there, more specifically close above there on a daily timeframe, it’s likely that we would continue to go much higher, perhaps reaching towards the $55 level above. Pullbacks at this point should continue to find support near the $50 level, as it is a large, round, psychologically significant number, and should allow for plenty of buying pressure. A breakdown below there would be rather negative, but right now I think the market is consolidating with a decidedly upward flavor to it.
WTI Video 23.10.17
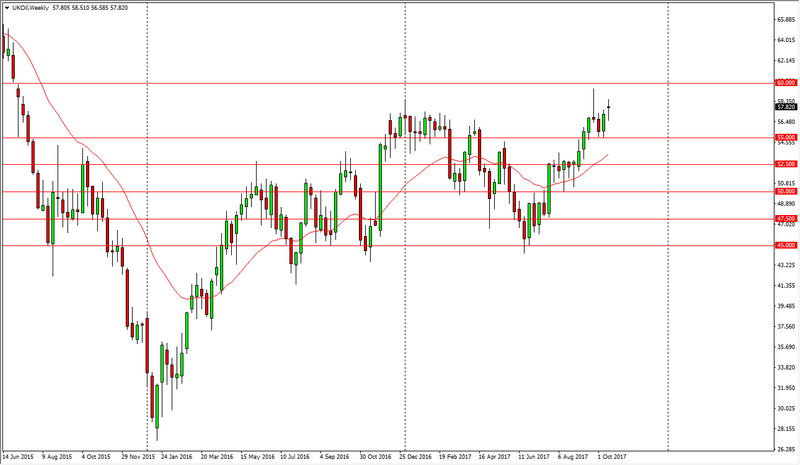
Brent
Brent markets gapped higher at the open during the week, turned around to fall and fill the gap, and then ended up bouncing enough to form a bit of a hammer. The hammer is very bullish, and it looks as if we are going to test the $60 level above. That’s an area that of course could cause a bit of resistance, but clearing that area would free this market to go to much higher levels. In fact, I think that could change everything for Brent as $60 could be the gateway to much higher pricing. Alternately, if we were to break down below the $55 level, the market probably goes down to the $50 level via the $52.50 level. I think we are getting ready to see significant moves, but right now the market is winding itself open as we are trying to discern between potential cut in production by Russia and Saudi Arabia, but at the same time when pricing gets to be too expensive, Americans are more than willing to start drilling even more.
This article was originally posted on FX Empire
More From FXEMPIRE:
EUR/USD forecast for the week of October 23, 2017, Technical Analysis
USD/CAD forecast for the week of October 23, 2017, Technical Analysis
GBP/USD forecast for the week of October 23, 2017, Technical Analysis
AUD/USD Forex Technical Analysis – After Sideways Trade, Downtrend Ready to Resume
NZD/USD forecast for the week of October 23, 2017, Technical Analysis
