
 Yahoo Finance
 What Is Cracker Barrel Old Country Store's (NASDAQ:CBRL) P/E Ratio After Its Share Price Rocketed?

Those holding Cracker Barrel Old Country Store (NASDAQ:CBRL) shares must be pleased that the share price has rebounded 31% in the last thirty days. But unfortunately, the stock is still down by 42% over a quarter. But shareholders may not all be feeling jubilant, since the share price is still down 41% in the last year.
All else being equal, a sharp share price increase should make a stock less attractive to potential investors. While the market sentiment towards a stock is very changeable, in the long run, the share price will tend to move in the same direction as earnings per share. The implication here is that deep value investors might steer clear when expectations of a company are too high. Perhaps the simplest way to get a read on investors' expectations of a business is to look at its Price to Earnings Ratio (PE Ratio). Investors have optimistic expectations of companies with higher P/E ratios, compared to companies with lower P/E ratios.
Check out our latest analysis for Cracker Barrel Old Country Store
Does Cracker Barrel Old Country Store Have A Relatively High Or Low P/E For Its Industry?
We can tell from its P/E ratio of 10.02 that sentiment around Cracker Barrel Old Country Store isn't particularly high. We can see in the image below that the average P/E (12.8) for companies in the hospitality industry is higher than Cracker Barrel Old Country Store's P/E.
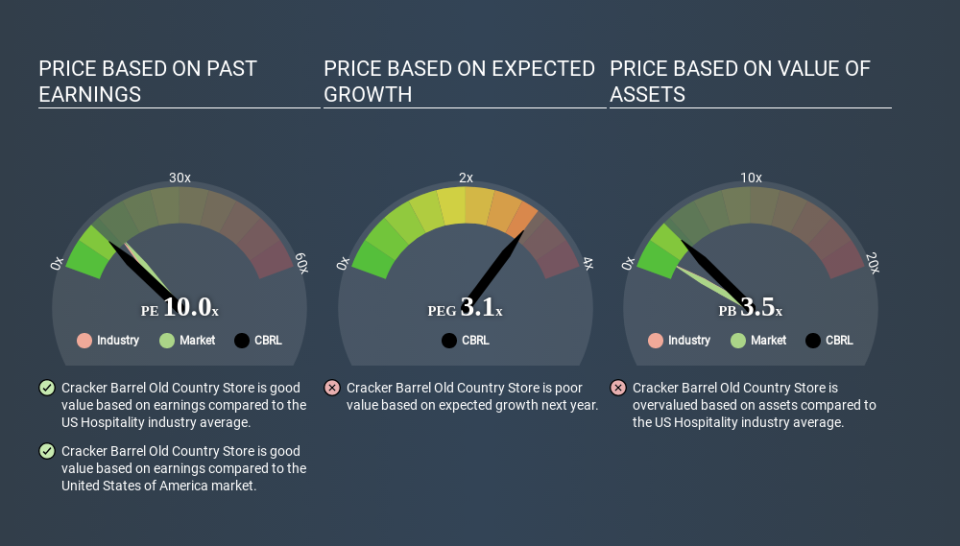
This suggests that market participants think Cracker Barrel Old Country Store will underperform other companies in its industry. Since the market seems unimpressed with Cracker Barrel Old Country Store, it's quite possible it could surprise on the upside. It is arguably worth checking if insiders are buying shares, because that might imply they believe the stock is undervalued.
How Growth Rates Impact P/E Ratios
P/E ratios primarily reflect market expectations around earnings growth rates. Earnings growth means that in the future the 'E' will be higher. That means unless the share price increases, the P/E will reduce in a few years. And as that P/E ratio drops, the company will look cheap, unless its share price increases.
Cracker Barrel Old Country Store's earnings per share were pretty steady over the last year. But it has grown its earnings per share by 7.9% per year over the last five years.
A Limitation: P/E Ratios Ignore Debt and Cash In The Bank
One drawback of using a P/E ratio is that it considers market capitalization, but not the balance sheet. That means it doesn't take debt or cash into account. The exact same company would hypothetically deserve a higher P/E ratio if it had a strong balance sheet, than if it had a weak one with lots of debt, because a cashed up company can spend on growth.
While growth expenditure doesn't always pay off, the point is that it is a good option to have; but one that the P/E ratio ignores.
Is Debt Impacting Cracker Barrel Old Country Store's P/E?
Cracker Barrel Old Country Store's net debt is 18% of its market cap. It would probably deserve a higher P/E ratio if it was net cash, since it would have more options for growth.
The Bottom Line On Cracker Barrel Old Country Store's P/E Ratio
Cracker Barrel Old Country Store trades on a P/E ratio of 10.0, which is below the US market average of 13.6. EPS grew over the last twelve months, and debt levels are quite reasonable. If growth is sustainable over the long term, then the current P/E ratio may be a sign of good value. What is very clear is that the market has become more optimistic about Cracker Barrel Old Country Store over the last month, with the P/E ratio rising from 7.6 back then to 10.0 today. For those who prefer to invest with the flow of momentum, that might mean it's time to put the stock on a watchlist, or research it. But the contrarian may see it as a missed opportunity.
Investors have an opportunity when market expectations about a stock are wrong. If it is underestimating a company, investors can make money by buying and holding the shares until the market corrects itself. So this free visual report on analyst forecasts could hold the key to an excellent investment decision.
You might be able to find a better buy than Cracker Barrel Old Country Store. If you want a selection of possible winners, check out this free list of interesting companies that trade on a P/E below 20 (but have proven they can grow earnings).
If you spot an error that warrants correction, please contact the editor at editorial-team@simplywallst.com. This article by Simply Wall St is general in nature. It does not constitute a recommendation to buy or sell any stock, and does not take account of your objectives, or your financial situation. Simply Wall St has no position in the stocks mentioned.
We aim to bring you long-term focused research analysis driven by fundamental data. Note that our analysis may not factor in the latest price-sensitive company announcements or qualitative material. Thank you for reading.
