
 Yahoo Finance
 Do You Like Cracker Barrel Old Country Store, Inc. (NASDAQ:CBRL) At This P/E Ratio?

This article is for investors who would like to improve their understanding of price to earnings ratios (P/E ratios). To keep it practical, we'll show how Cracker Barrel Old Country Store, Inc.'s (NASDAQ:CBRL) P/E ratio could help you assess the value on offer. Looking at earnings over the last twelve months, Cracker Barrel Old Country Store has a P/E ratio of 17.07. That is equivalent to an earnings yield of about 5.9%.
See our latest analysis for Cracker Barrel Old Country Store
How Do You Calculate A P/E Ratio?
The formula for price to earnings is:
Price to Earnings Ratio = Price per Share ÷ Earnings per Share (EPS)
Or for Cracker Barrel Old Country Store:
P/E of 17.07 = $158.67 ÷ $9.29 (Based on the trailing twelve months to August 2019.)
Is A High Price-to-Earnings Ratio Good?
The higher the P/E ratio, the higher the price tag of a business, relative to its trailing earnings. That isn't necessarily good or bad, but a high P/E implies relatively high expectations of what a company can achieve in the future.
How Does Cracker Barrel Old Country Store's P/E Ratio Compare To Its Peers?
We can get an indication of market expectations by looking at the P/E ratio. If you look at the image below, you can see Cracker Barrel Old Country Store has a lower P/E than the average (22.5) in the hospitality industry classification.
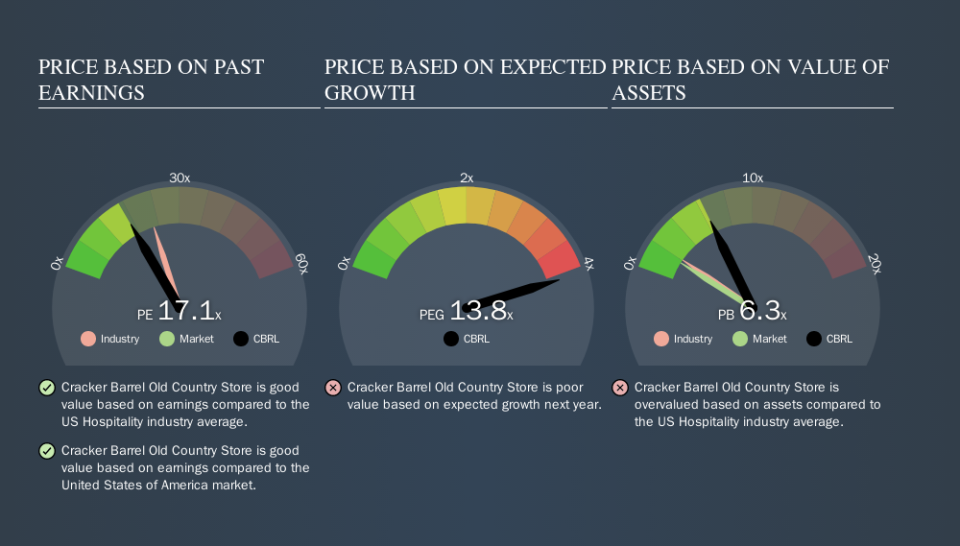
This suggests that market participants think Cracker Barrel Old Country Store will underperform other companies in its industry. Many investors like to buy stocks when the market is pessimistic about their prospects. It is arguably worth checking if insiders are buying shares, because that might imply they believe the stock is undervalued.
How Growth Rates Impact P/E Ratios
Probably the most important factor in determining what P/E a company trades on is the earnings growth. That's because companies that grow earnings per share quickly will rapidly increase the 'E' in the equation. Therefore, even if you pay a high multiple of earnings now, that multiple will become lower in the future. Then, a lower P/E should attract more buyers, pushing the share price up.
Cracker Barrel Old Country Store shrunk earnings per share by 9.9% last year. But it has grown its earnings per share by 11% per year over the last five years.
Remember: P/E Ratios Don't Consider The Balance Sheet
One drawback of using a P/E ratio is that it considers market capitalization, but not the balance sheet. In other words, it does not consider any debt or cash that the company may have on the balance sheet. The exact same company would hypothetically deserve a higher P/E ratio if it had a strong balance sheet, than if it had a weak one with lots of debt, because a cashed up company can spend on growth.
Such expenditure might be good or bad, in the long term, but the point here is that the balance sheet is not reflected by this ratio.
Is Debt Impacting Cracker Barrel Old Country Store's P/E?
Cracker Barrel Old Country Store has net debt worth just 9.8% of its market capitalization. The market might award it a higher P/E ratio if it had net cash, but its unlikely this low level of net borrowing is having a big impact on the P/E multiple.
The Verdict On Cracker Barrel Old Country Store's P/E Ratio
Cracker Barrel Old Country Store has a P/E of 17.1. That's around the same as the average in the US market, which is 17.7. With modest debt, and a lack of recent growth, it would seem the market is expecting improvement in earnings.
Investors have an opportunity when market expectations about a stock are wrong. If it is underestimating a company, investors can make money by buying and holding the shares until the market corrects itself. So this free visual report on analyst forecasts could hold the key to an excellent investment decision.
Of course, you might find a fantastic investment by looking at a few good candidates. So take a peek at this free list of companies with modest (or no) debt, trading on a P/E below 20.
We aim to bring you long-term focused research analysis driven by fundamental data. Note that our analysis may not factor in the latest price-sensitive company announcements or qualitative material.
If you spot an error that warrants correction, please contact the editor at editorial-team@simplywallst.com. This article by Simply Wall St is general in nature. It does not constitute a recommendation to buy or sell any stock, and does not take account of your objectives, or your financial situation. Simply Wall St has no position in the stocks mentioned. Thank you for reading.
