
 Yahoo Finance
 Coventry Group Ltd's (ASX:CYG) Fundamentals Look Pretty Strong: Could The Market Be Wrong About The Stock?
Coventry Group (ASX:CYG) has had a rough three months with its share price down 26%. But if you pay close attention, you might find that its key financial indicators look quite decent, which could mean that the stock could potentially rise in the long-term given how markets usually reward more resilient long-term fundamentals. Specifically, we decided to study Coventry Group's ROE in this article.
Return on equity or ROE is an important factor to be considered by a shareholder because it tells them how effectively their capital is being reinvested. In other words, it is a profitability ratio which measures the rate of return on the capital provided by the company's shareholders.
Check out our latest analysis for Coventry Group
How Do You Calculate Return On Equity?
The formula for ROE is:
Return on Equity = Net Profit (from continuing operations) ÷ Shareholders' Equity
So, based on the above formula, the ROE for Coventry Group is:
7.7% = AU$8.5m ÷ AU$111m (Based on the trailing twelve months to December 2021).
The 'return' is the yearly profit. So, this means that for every A$1 of its shareholder's investments, the company generates a profit of A$0.08.
What Has ROE Got To Do With Earnings Growth?
We have already established that ROE serves as an efficient profit-generating gauge for a company's future earnings. We now need to evaluate how much profit the company reinvests or "retains" for future growth which then gives us an idea about the growth potential of the company. Generally speaking, other things being equal, firms with a high return on equity and profit retention, have a higher growth rate than firms that don’t share these attributes.
Coventry Group's Earnings Growth And 7.7% ROE
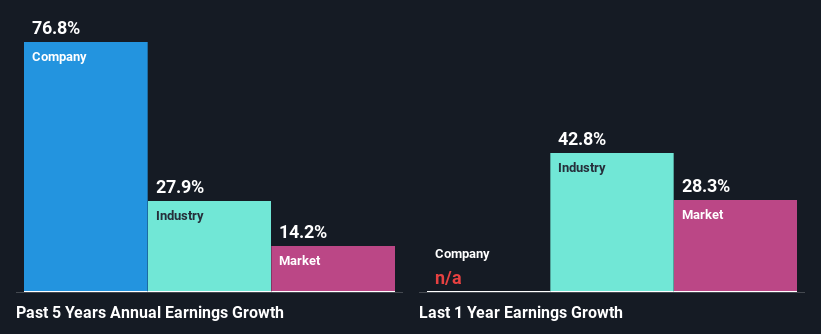
At first glance, Coventry Group's ROE doesn't look very promising. A quick further study shows that the company's ROE doesn't compare favorably to the industry average of 11% either. In spite of this, Coventry Group was able to grow its net income considerably, at a rate of 77% in the last five years. We reckon that there could be other factors at play here. For example, it is possible that the company's management has made some good strategic decisions, or that the company has a low payout ratio.
As a next step, we compared Coventry Group's net income growth with the industry, and pleasingly, we found that the growth seen by the company is higher than the average industry growth of 28%.
The basis for attaching value to a company is, to a great extent, tied to its earnings growth. It’s important for an investor to know whether the market has priced in the company's expected earnings growth (or decline). This then helps them determine if the stock is placed for a bright or bleak future. Is Coventry Group fairly valued compared to other companies? These 3 valuation measures might help you decide.
Is Coventry Group Making Efficient Use Of Its Profits?
The three-year median payout ratio for Coventry Group is 34%, which is moderately low. The company is retaining the remaining 66%. So it seems that Coventry Group is reinvesting efficiently in a way that it sees impressive growth in its earnings (discussed above) and pays a dividend that's well covered.
Additionally, Coventry Group has paid dividends over a period of at least ten years which means that the company is pretty serious about sharing its profits with shareholders. Our latest analyst data shows that the future payout ratio of the company over the next three years is expected to be approximately 30%. However, Coventry Group's ROE is predicted to rise to 9.7% despite there being no anticipated change in its payout ratio.
Conclusion
On the whole, we do feel that Coventry Group has some positive attributes. Even in spite of the low rate of return, the company has posted impressive earnings growth as a result of reinvesting heavily into its business. That being so, a study of the latest analyst forecasts show that the company is expected to see a slowdown in its future earnings growth. To know more about the latest analysts predictions for the company, check out this visualization of analyst forecasts for the company.
Have feedback on this article? Concerned about the content? Get in touch with us directly. Alternatively, email editorial-team (at) simplywallst.com.
This article by Simply Wall St is general in nature. We provide commentary based on historical data and analyst forecasts only using an unbiased methodology and our articles are not intended to be financial advice. It does not constitute a recommendation to buy or sell any stock, and does not take account of your objectives, or your financial situation. We aim to bring you long-term focused analysis driven by fundamental data. Note that our analysis may not factor in the latest price-sensitive company announcements or qualitative material. Simply Wall St has no position in any stocks mentioned.
