
 Yahoo Finance
 Could The Market Be Wrong About Flex Ltd. (NASDAQ:FLEX) Given Its Attractive Financial Prospects?
Flex (NASDAQ:FLEX) has had a rough three months with its share price down 15%. However, stock prices are usually driven by a company’s financial performance over the long term, which in this case looks quite promising. In this article, we decided to focus on Flex's ROE.
ROE or return on equity is a useful tool to assess how effectively a company can generate returns on the investment it received from its shareholders. Put another way, it reveals the company's success at turning shareholder investments into profits.
View our latest analysis for Flex
How Do You Calculate Return On Equity?
Return on equity can be calculated by using the formula:
Return on Equity = Net Profit (from continuing operations) ÷ Shareholders' Equity
So, based on the above formula, the ROE for Flex is:
22% = US$940m ÷ US$4.2b (Based on the trailing twelve months to March 2022).
The 'return' is the yearly profit. So, this means that for every $1 of its shareholder's investments, the company generates a profit of $0.22.
What Has ROE Got To Do With Earnings Growth?
So far, we've learned that ROE is a measure of a company's profitability. We now need to evaluate how much profit the company reinvests or "retains" for future growth which then gives us an idea about the growth potential of the company. Assuming all else is equal, companies that have both a higher return on equity and higher profit retention are usually the ones that have a higher growth rate when compared to companies that don't have the same features.
Flex's Earnings Growth And 22% ROE
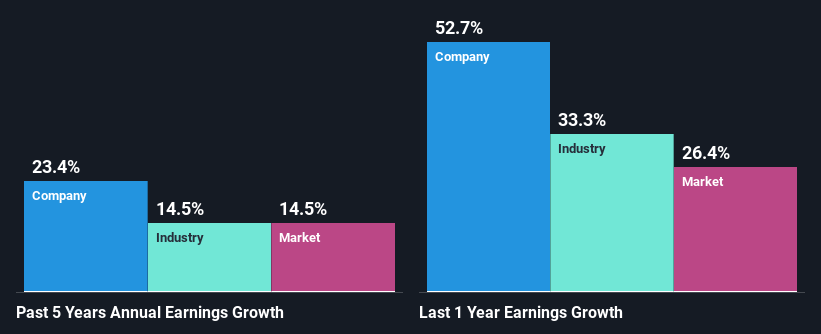
Firstly, we acknowledge that Flex has a significantly high ROE. Secondly, even when compared to the industry average of 13% the company's ROE is quite impressive. Under the circumstances, Flex's considerable five year net income growth of 23% was to be expected.
Next, on comparing with the industry net income growth, we found that Flex's growth is quite high when compared to the industry average growth of 15% in the same period, which is great to see.
The basis for attaching value to a company is, to a great extent, tied to its earnings growth. What investors need to determine next is if the expected earnings growth, or the lack of it, is already built into the share price. Doing so will help them establish if the stock's future looks promising or ominous. Is Flex fairly valued compared to other companies? These 3 valuation measures might help you decide.
Is Flex Making Efficient Use Of Its Profits?
Flex doesn't pay any dividend currently which essentially means that it has been reinvesting all of its profits into the business. This definitely contributes to the high earnings growth number that we discussed above.
Conclusion
In total, we are pretty happy with Flex's performance. Specifically, we like that the company is reinvesting a huge chunk of its profits at a high rate of return. This of course has caused the company to see substantial growth in its earnings. With that said, on studying the latest analyst forecasts, we found that while the company has seen growth in its past earnings, analysts expect its future earnings to shrink. To know more about the latest analysts predictions for the company, check out this visualization of analyst forecasts for the company.
Have feedback on this article? Concerned about the content? Get in touch with us directly. Alternatively, email editorial-team (at) simplywallst.com.
This article by Simply Wall St is general in nature. We provide commentary based on historical data and analyst forecasts only using an unbiased methodology and our articles are not intended to be financial advice. It does not constitute a recommendation to buy or sell any stock, and does not take account of your objectives, or your financial situation. We aim to bring you long-term focused analysis driven by fundamental data. Note that our analysis may not factor in the latest price-sensitive company announcements or qualitative material. Simply Wall St has no position in any stocks mentioned.
