
 Yahoo Finance
 Can Costa Group Holdings Limited's (ASX:CGC) Weak Financials Pull The Plug On The Stock's Current Momentum On Its Share Price?
Most readers would already be aware that Costa Group Holdings' (ASX:CGC) stock increased significantly by 20% over the past three months. However, we decided to pay close attention to its weak financials as we are doubtful that the current momentum will keep up, given the scenario. Specifically, we decided to study Costa Group Holdings' ROE in this article.
Return on equity or ROE is a key measure used to assess how efficiently a company's management is utilizing the company's capital. In other words, it is a profitability ratio which measures the rate of return on the capital provided by the company's shareholders.
Check out our latest analysis for Costa Group Holdings
How To Calculate Return On Equity?
Return on equity can be calculated by using the formula:
Return on Equity = Net Profit (from continuing operations) ÷ Shareholders' Equity
So, based on the above formula, the ROE for Costa Group Holdings is:
6.3% = AU$54m ÷ AU$847m (Based on the trailing twelve months to July 2022).
The 'return' is the income the business earned over the last year. Another way to think of that is that for every A$1 worth of equity, the company was able to earn A$0.06 in profit.
What Is The Relationship Between ROE And Earnings Growth?
Thus far, we have learned that ROE measures how efficiently a company is generating its profits. Based on how much of its profits the company chooses to reinvest or "retain", we are then able to evaluate a company's future ability to generate profits. Generally speaking, other things being equal, firms with a high return on equity and profit retention, have a higher growth rate than firms that don’t share these attributes.
Costa Group Holdings' Earnings Growth And 6.3% ROE
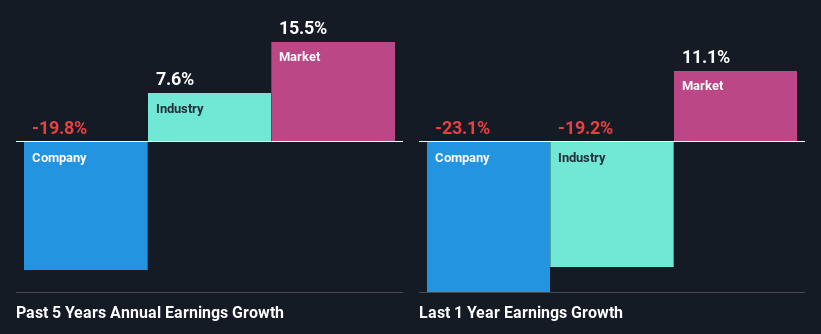
When you first look at it, Costa Group Holdings' ROE doesn't look that attractive. However, given that the company's ROE is similar to the average industry ROE of 7.8%, we may spare it some thought. But then again, Costa Group Holdings' five year net income shrunk at a rate of 20%. Bear in mind, the company does have a slightly low ROE. Hence, this goes some way in explaining the shrinking earnings.
So, as a next step, we compared Costa Group Holdings' performance against the industry and were disappointed to discover that while the company has been shrinking its earnings, the industry has been growing its earnings at a rate of 7.6% in the same period.
Earnings growth is an important metric to consider when valuing a stock. The investor should try to establish if the expected growth or decline in earnings, whichever the case may be, is priced in. By doing so, they will have an idea if the stock is headed into clear blue waters or if swampy waters await. Is Costa Group Holdings fairly valued compared to other companies? These 3 valuation measures might help you decide.
Is Costa Group Holdings Making Efficient Use Of Its Profits?
With a high three-year median payout ratio of 66% (implying that 34% of the profits are retained), most of Costa Group Holdings' profits are being paid to shareholders, which explains the company's shrinking earnings. With only very little left to reinvest into the business, growth in earnings is far from likely. To know the 3 risks we have identified for Costa Group Holdings visit our risks dashboard for free.
Additionally, Costa Group Holdings has paid dividends over a period of seven years, which means that the company's management is rather focused on keeping up its dividend payments, regardless of the shrinking earnings. Based on the latest analysts' estimates, we found that the company's future payout ratio over the next three years is expected to hold steady at 58%. Regardless, the future ROE for Costa Group Holdings is predicted to rise to 10% despite there being not much change expected in its payout ratio.
Conclusion
In total, we would have a hard think before deciding on any investment action concerning Costa Group Holdings. The company has seen a lack of earnings growth as a result of retaining very little profits and whatever little it does retain, is being reinvested at a very low rate of return. That being so, the latest industry analyst forecasts show that the analysts are expecting to see a huge improvement in the company's earnings growth rate. To know more about the latest analysts predictions for the company, check out this visualization of analyst forecasts for the company.
Have feedback on this article? Concerned about the content? Get in touch with us directly. Alternatively, email editorial-team (at) simplywallst.com.
This article by Simply Wall St is general in nature. We provide commentary based on historical data and analyst forecasts only using an unbiased methodology and our articles are not intended to be financial advice. It does not constitute a recommendation to buy or sell any stock, and does not take account of your objectives, or your financial situation. We aim to bring you long-term focused analysis driven by fundamental data. Note that our analysis may not factor in the latest price-sensitive company announcements or qualitative material. Simply Wall St has no position in any stocks mentioned.
Join A Paid User Research Session
You’ll receive a US$30 Amazon Gift card for 1 hour of your time while helping us build better investing tools for the individual investors like yourself. Sign up here
