
 Yahoo Finance
 Cosmo Pharmaceuticals (VTX:COPN) shareholders have endured a 18% loss from investing in the stock three years ago
While not a mind-blowing move, it is good to see that the Cosmo Pharmaceuticals N.V. (VTX:COPN) share price has gained 28% in the last three months. But that doesn't change the fact that the returns over the last three years have been less than pleasing. Truth be told the share price declined 21% in three years and that return, Dear Reader, falls short of what you could have got from passive investing with an index fund.
Since shareholders are down over the longer term, lets look at the underlying fundamentals over the that time and see if they've been consistent with returns.
Check out our latest analysis for Cosmo Pharmaceuticals
While Cosmo Pharmaceuticals made a small profit, in the last year, we think that the market is probably more focussed on the top line growth at the moment. As a general rule, we think this kind of company is more comparable to loss-making stocks, since the actual profit is so low. For shareholders to have confidence a company will grow profits significantly, it must grow revenue.
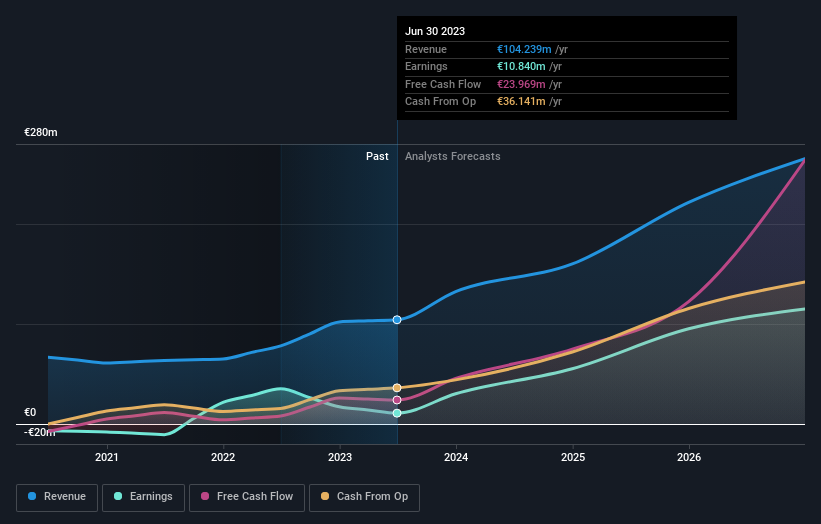
In the last three years, Cosmo Pharmaceuticals saw its revenue grow by 20% per year, compound. That's well above most other pre-profit companies. The share price drop of 7% per year over three years would be considered disappointing by many, so you might argue the company is getting little credit for its impressive revenue growth. It's possible that the prior share price assumed unrealistically high future growth. Still, with high hopes now tempered, now might prove to be an opportunity to buy.
You can see how earnings and revenue have changed over time in the image below (click on the chart to see the exact values).
We know that Cosmo Pharmaceuticals has improved its bottom line over the last three years, but what does the future have in store? You can see how its balance sheet has strengthened (or weakened) over time in this free interactive graphic.
What About Dividends?
It is important to consider the total shareholder return, as well as the share price return, for any given stock. The TSR is a return calculation that accounts for the value of cash dividends (assuming that any dividend received was reinvested) and the calculated value of any discounted capital raisings and spin-offs. So for companies that pay a generous dividend, the TSR is often a lot higher than the share price return. As it happens, Cosmo Pharmaceuticals' TSR for the last 3 years was -18%, which exceeds the share price return mentioned earlier. The dividends paid by the company have thusly boosted the total shareholder return.
A Different Perspective
We're pleased to report that Cosmo Pharmaceuticals shareholders have received a total shareholder return of 19% over one year. Of course, that includes the dividend. Notably the five-year annualised TSR loss of 3% per year compares very unfavourably with the recent share price performance. We generally put more weight on the long term performance over the short term, but the recent improvement could hint at a (positive) inflection point within the business. While it is well worth considering the different impacts that market conditions can have on the share price, there are other factors that are even more important. Case in point: We've spotted 1 warning sign for Cosmo Pharmaceuticals you should be aware of.
For those who like to find winning investments this free list of growing companies with recent insider purchasing, could be just the ticket.
Please note, the market returns quoted in this article reflect the market weighted average returns of stocks that currently trade on Swiss exchanges.
Have feedback on this article? Concerned about the content? Get in touch with us directly. Alternatively, email editorial-team (at) simplywallst.com.
This article by Simply Wall St is general in nature. We provide commentary based on historical data and analyst forecasts only using an unbiased methodology and our articles are not intended to be financial advice. It does not constitute a recommendation to buy or sell any stock, and does not take account of your objectives, or your financial situation. We aim to bring you long-term focused analysis driven by fundamental data. Note that our analysis may not factor in the latest price-sensitive company announcements or qualitative material. Simply Wall St has no position in any stocks mentioned.
