
 Yahoo Finance
 Is Service Corporation International's (NYSE:SCI) P/E Ratio Really That Good?

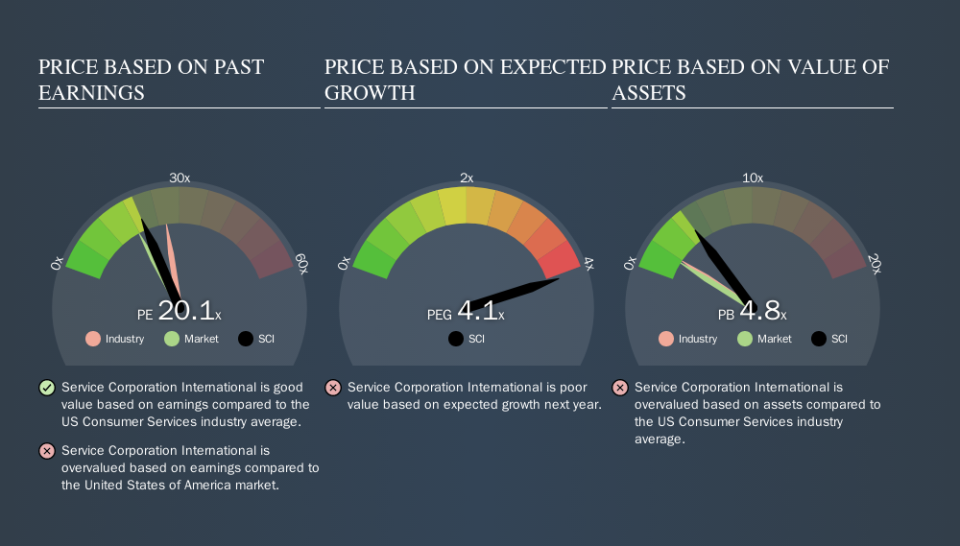
This article is written for those who want to get better at using price to earnings ratios (P/E ratios). To keep it practical, we'll show how Service Corporation International's (NYSE:SCI) P/E ratio could help you assess the value on offer. Looking at earnings over the last twelve months, Service Corporation International has a P/E ratio of 20.11. That means that at current prices, buyers pay $20.11 for every $1 in trailing yearly profits.
Check out our latest analysis for Service Corporation International
How Do I Calculate A Price To Earnings Ratio?
The formula for price to earnings is:
Price to Earnings Ratio = Price per Share ÷ Earnings per Share (EPS)
Or for Service Corporation International:
P/E of 20.11 = $45.82 ÷ $2.28 (Based on the year to June 2019.)
Is A High P/E Ratio Good?
A higher P/E ratio implies that investors pay a higher price for the earning power of the business. That is not a good or a bad thing per se, but a high P/E does imply buyers are optimistic about the future.
How Does Service Corporation International's P/E Ratio Compare To Its Peers?
The P/E ratio indicates whether the market has higher or lower expectations of a company. We can see in the image below that the average P/E (26.0) for companies in the consumer services industry is higher than Service Corporation International's P/E.
Its relatively low P/E ratio indicates that Service Corporation International shareholders think it will struggle to do as well as other companies in its industry classification. Many investors like to buy stocks when the market is pessimistic about their prospects. It is arguably worth checking if insiders are buying shares, because that might imply they believe the stock is undervalued.
How Growth Rates Impact P/E Ratios
Earnings growth rates have a big influence on P/E ratios. When earnings grow, the 'E' increases, over time. That means even if the current P/E is high, it will reduce over time if the share price stays flat. And as that P/E ratio drops, the company will look cheap, unless its share price increases.
Service Corporation International saw earnings per share decrease by 13% last year. But it has grown its earnings per share by 32% per year over the last five years.
Don't Forget: The P/E Does Not Account For Debt or Bank Deposits
The 'Price' in P/E reflects the market capitalization of the company. In other words, it does not consider any debt or cash that the company may have on the balance sheet. Hypothetically, a company could reduce its future P/E ratio by spending its cash (or taking on debt) to achieve higher earnings.
While growth expenditure doesn't always pay off, the point is that it is a good option to have; but one that the P/E ratio ignores.
Is Debt Impacting Service Corporation International's P/E?
Service Corporation International's net debt equates to 38% of its market capitalization. You'd want to be aware of this fact, but it doesn't bother us.
The Verdict On Service Corporation International's P/E Ratio
Service Corporation International has a P/E of 20.1. That's higher than the average in its market, which is 17.8. With modest debt but no EPS growth in the last year, it's fair to say the P/E implies some optimism about future earnings, from the market.
When the market is wrong about a stock, it gives savvy investors an opportunity. If the reality for a company is better than it expects, you can make money by buying and holding for the long term. So this free visualization of the analyst consensus on future earnings could help you make the right decision about whether to buy, sell, or hold.
Of course you might be able to find a better stock than Service Corporation International. So you may wish to see this free collection of other companies that have grown earnings strongly.
We aim to bring you long-term focused research analysis driven by fundamental data. Note that our analysis may not factor in the latest price-sensitive company announcements or qualitative material.
If you spot an error that warrants correction, please contact the editor at editorial-team@simplywallst.com. This article by Simply Wall St is general in nature. It does not constitute a recommendation to buy or sell any stock, and does not take account of your objectives, or your financial situation. Simply Wall St has no position in the stocks mentioned. Thank you for reading.
