
 Yahoo Finance
 Service Corporation International (NYSE:SCI) Has A Somewhat Strained Balance Sheet

Howard Marks put it nicely when he said that, rather than worrying about share price volatility, 'The possibility of permanent loss is the risk I worry about... and every practical investor I know worries about. So it seems the smart money knows that debt - which is usually involved in bankruptcies - is a very important factor, when you assess how risky a company is. We note that Service Corporation International (NYSE:SCI) does have debt on its balance sheet. But the more important question is: how much risk is that debt creating?
When Is Debt Dangerous?
Debt assists a business until the business has trouble paying it off, either with new capital or with free cash flow. Part and parcel of capitalism is the process of 'creative destruction' where failed businesses are mercilessly liquidated by their bankers. However, a more frequent (but still costly) occurrence is where a company must issue shares at bargain-basement prices, permanently diluting shareholders, just to shore up its balance sheet. Having said that, the most common situation is where a company manages its debt reasonably well - and to its own advantage. When we think about a company's use of debt, we first look at cash and debt together.
See our latest analysis for Service Corporation International
What Is Service Corporation International's Net Debt?
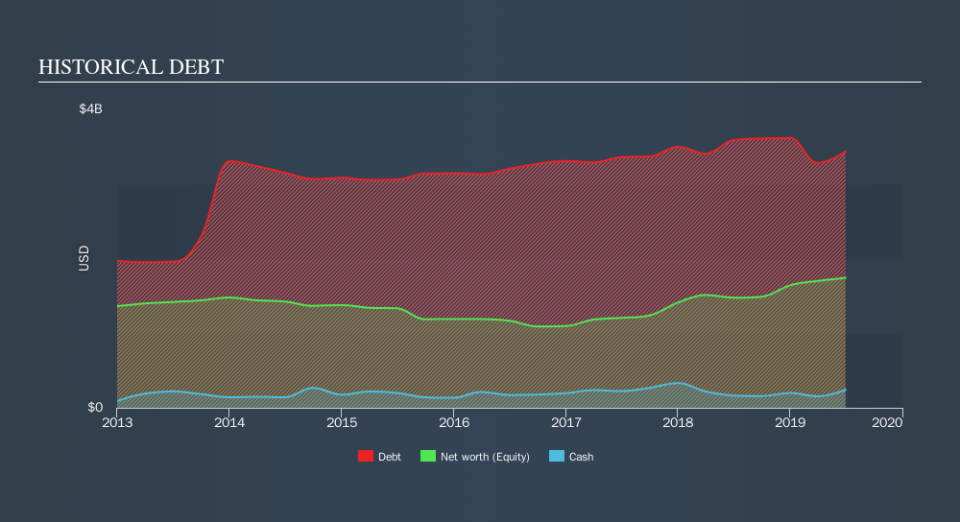
The image below, which you can click on for greater detail, shows that Service Corporation International had debt of US$3.43b at the end of June 2019, a reduction from US$3.59b over a year. However, it also had US$243.7m in cash, and so its net debt is US$3.19b.
How Strong Is Service Corporation International's Balance Sheet?
Zooming in on the latest balance sheet data, we can see that Service Corporation International had liabilities of US$614.5m due within 12 months and liabilities of US$11.0b due beyond that. On the other hand, it had cash of US$243.7m and US$82.3m worth of receivables due within a year. So its liabilities outweigh the sum of its cash and (near-term) receivables by US$11.3b.
Given this deficit is actually higher than the company's market capitalization of US$8.24b, we think shareholders really should watch Service Corporation International's debt levels, like a parent watching their child ride a bike for the first time. Hypothetically, extremely heavy dilution would be required if the company were forced to pay down its liabilities by raising capital at the current share price.
We use two main ratios to inform us about debt levels relative to earnings. The first is net debt divided by earnings before interest, tax, depreciation, and amortization (EBITDA), while the second is how many times its earnings before interest and tax (EBIT) covers its interest expense (or its interest cover, for short). The advantage of this approach is that we take into account both the absolute quantum of debt (with net debt to EBITDA) and the actual interest expenses associated with that debt (with its interest cover ratio).
Service Corporation International's debt is 3.7 times its EBITDA, and its EBIT cover its interest expense 3.3 times over. This suggests that while the debt levels are significant, we'd stop short of calling them problematic. More concerning, Service Corporation International saw its EBIT drop by 2.5% in the last twelve months. If that earnings trend continues the company will face an uphill battle to pay off its debt. The balance sheet is clearly the area to focus on when you are analysing debt. But it is future earnings, more than anything, that will determine Service Corporation International's ability to maintain a healthy balance sheet going forward. So if you're focused on the future you can check out this free report showing analyst profit forecasts.
But our final consideration is also important, because a company cannot pay debt with paper profits; it needs cold hard cash. So it's worth checking how much of that EBIT is backed by free cash flow. Over the most recent three years, Service Corporation International recorded free cash flow worth 52% of its EBIT, which is around normal, given free cash flow excludes interest and tax. This cold hard cash means it can reduce its debt when it wants to.
Our View
Mulling over Service Corporation International's attempt at staying on top of its total liabilities, we're certainly not enthusiastic. Having said that, its ability to convert EBIT to free cash flow isn't such a worry. We're quite clear that we consider Service Corporation International to be really rather risky, as a result of its balance sheet health. For this reason we're pretty cautious about the stock, and we think shareholders should keep a close eye on its liquidity. In light of our reservations about the company's balance sheet, it seems sensible to check if insiders have been selling shares recently.
If, after all that, you're more interested in a fast growing company with a rock-solid balance sheet, then check out our list of net cash growth stocks without delay.
We aim to bring you long-term focused research analysis driven by fundamental data. Note that our analysis may not factor in the latest price-sensitive company announcements or qualitative material.
If you spot an error that warrants correction, please contact the editor at editorial-team@simplywallst.com. This article by Simply Wall St is general in nature. It does not constitute a recommendation to buy or sell any stock, and does not take account of your objectives, or your financial situation. Simply Wall St has no position in the stocks mentioned. Thank you for reading.
