
 Yahoo Finance
 Is Cooper Energy's (ASX:COE) 113% Share Price Increase Well Justified?

Want to participate in a research study? Help shape the future of investing tools and earn a $60 gift card!
The most you can lose on any stock (assuming you don't use leverage) is 100% of your money. But if you buy shares in a really great company, you can more than double your money. For example, the Cooper Energy Limited (ASX:COE) share price has soared 113% in the last three years. How nice for those who held the stock! On top of that, the share price is up 20% in about a quarter. But this move may well have been assisted by the reasonably buoyant market (up 12% in 90 days).
Check out our latest analysis for Cooper Energy
To quote Buffett, 'Ships will sail around the world but the Flat Earth Society will flourish. There will continue to be wide discrepancies between price and value in the marketplace...' One flawed but reasonable way to assess how sentiment around a company has changed is to compare the earnings per share (EPS) with the share price.
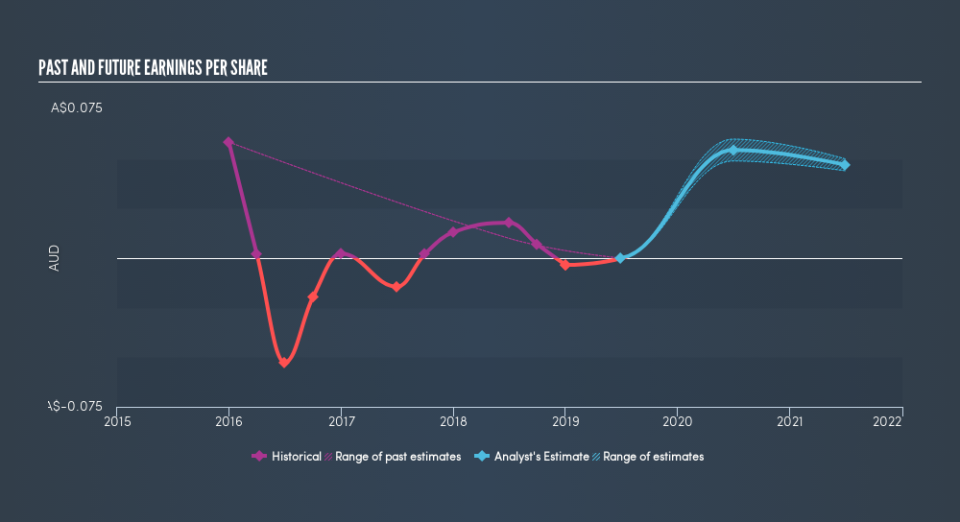
Cooper Energy was able to grow its EPS at 2.7% per year over three years, sending the share price higher. This EPS growth is lower than the 29% average annual increase in the share price. This suggests that, as the business progressed over the last few years, it gained the confidence of market participants. It is quite common to see investors become enamoured with a business, after a few years of solid progress.
You can see how EPS has changed over time in the image below (click on the chart to see the exact values).
This free interactive report on Cooper Energy's earnings, revenue and cash flow is a great place to start, if you want to investigate the stock further.
What about the Total Shareholder Return (TSR)?
We'd be remiss not to mention the difference between Cooper Energy's total shareholder return (TSR) and its share price return. The TSR is a return calculation that accounts for the value of cash dividends (assuming that any dividend received was reinvested) and the calculated value of any discounted capital raisings and spin-offs. Cooper Energy hasn't been paying dividends, but its TSR of 145% exceeds its share price return of 113%, implying it has either spun-off a business, or raised capital at a discount; thereby providing additional value to shareholders.
A Different Perspective
It's good to see that Cooper Energy has rewarded shareholders with a total shareholder return of 62% in the last twelve months. Since the one-year TSR is better than the five-year TSR (the latter coming in at 2.5% per year), it would seem that the stock's performance has improved in recent times. In the best case scenario, this may hint at some real business momentum, implying that now could be a great time to delve deeper. If you would like to research Cooper Energy in more detail then you might want to take a look at whether insiders have been buying or selling shares in the company.
If you are like me, then you will not want to miss this free list of growing companies that insiders are buying.
Please note, the market returns quoted in this article reflect the market weighted average returns of stocks that currently trade on AU exchanges.
We aim to bring you long-term focused research analysis driven by fundamental data. Note that our analysis may not factor in the latest price-sensitive company announcements or qualitative material.
If you spot an error that warrants correction, please contact the editor at editorial-team@simplywallst.com. This article by Simply Wall St is general in nature. It does not constitute a recommendation to buy or sell any stock, and does not take account of your objectives, or your financial situation. Simply Wall St has no position in the stocks mentioned. Thank you for reading.
