
 Yahoo Finance
 Is Cooper Energy Limited (ASX:COE) Struggling With Its 0.6% Return On Capital Employed?

Today we’ll evaluate Cooper Energy Limited (ASX:COE) to determine whether it could have potential as an investment idea. Specifically, we’ll consider its Return On Capital Employed (ROCE), since that will give us an insight into how efficiently the business can generate profits from the capital it requires.
First, we’ll go over how we calculate ROCE. Next, we’ll compare it to others in its industry. Finally, we’ll look at how its current liabilities affect its ROCE.
Return On Capital Employed (ROCE): What is it?
ROCE is a measure of a company’s yearly pre-tax profit (its return), relative to the capital employed in the business. Generally speaking a higher ROCE is better. Ultimately, it is a useful but imperfect metric. Author Edwin Whiting says to be careful when comparing the ROCE of different businesses, since ‘No two businesses are exactly alike.’
How Do You Calculate Return On Capital Employed?
The formula for calculating the return on capital employed is:
Return on Capital Employed = Earnings Before Interest and Tax (EBIT) ÷ (Total Assets – Current Liabilities)
Or for Cooper Energy:
0.0065 = AU$4.4m ÷ (AU$817m – AU$134m) (Based on the trailing twelve months to June 2018.)
Therefore, Cooper Energy has an ROCE of 0.6%.
See our latest analysis for Cooper Energy
Does Cooper Energy Have A Good ROCE?
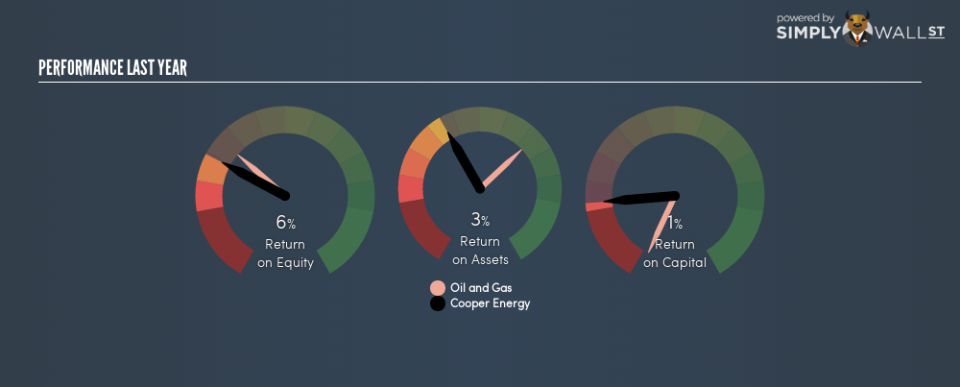
One way to assess ROCE is to compare similar companies. In this analysis, Cooper Energy’s ROCE appears meaningfully below the 6.5% average reported by the Oil and Gas industry. This could be seen as a negative, as it suggests some competitors may be employing their capital more efficiently. Independently of how Cooper Energy compares to its industry, its ROCE in absolute terms is low; especially compared to the ~2.3% available in government bonds. Readers may wish to look for more rewarding investments.
Cooper Energy delivered an ROCE of 0.6%, which is better than 3 years ago, as was making losses back then. That suggests the business has returned to profitability.
It is important to remember that ROCE shows past performance, and is not necessarily predictive. ROCE can be deceptive for cyclical businesses, as returns can look incredible in boom times, and terribly low in downturns. This is because ROCE only looks at one year, instead of considering returns across a whole cycle. Given the industry it operates in, Cooper Energy could be considered cyclical. What happens in the future is pretty important for investors, so we have prepared a free report on analyst forecasts for Cooper Energy.
Cooper Energy’s Current Liabilities And Their Impact On Its ROCE
Short term (or current) liabilities, are things like supplier invoices, overdrafts, or tax bills that need to be paid within 12 months. The ROCE equation subtracts current liabilities from capital employed, so a company with a lot of current liabilities appears to have less capital employed, and a higher ROCE than otherwise. To counter this, investors can check if a company has high current liabilities relative to total assets.
Cooper Energy has total liabilities of AU$134m and total assets of AU$817m. As a result, its current liabilities are equal to approximately 16% of its total assets. This is a modest level of current liabilities, which will have a limited impact on the ROCE.
The Bottom Line On Cooper Energy’s ROCE
Cooper Energy has a poor ROCE, and there may be better investment prospects out there. But note: Cooper Energy may not be the best stock to buy. So take a peek at this free list of interesting companies with strong recent earnings growth (and a P/E ratio below 20).
If you like to buy stocks alongside management, then you might just love this free list of companies. (Hint: insiders have been buying them).
To help readers see past the short term volatility of the financial market, we aim to bring you a long-term focused research analysis purely driven by fundamental data. Note that our analysis does not factor in the latest price-sensitive company announcements.
The author is an independent contributor and at the time of publication had no position in the stocks mentioned. For errors that warrant correction please contact the editor at editorial-team@simplywallst.com.
