
 Yahoo Finance
 Should You Consider Chart Industries, Inc. (NASDAQ:GTLS)?

Attractive stocks have exceptional fundamentals. In the case of Chart Industries, Inc. (NASDAQ:GTLS), there's is a financially-robust company with an optimistic future outlook, not yet reflected in the share price. In the following section, I expand a bit more on these key aspects. If you're interested in understanding beyond my broad commentary, take a look at the report on Chart Industries here.
Excellent balance sheet and good value
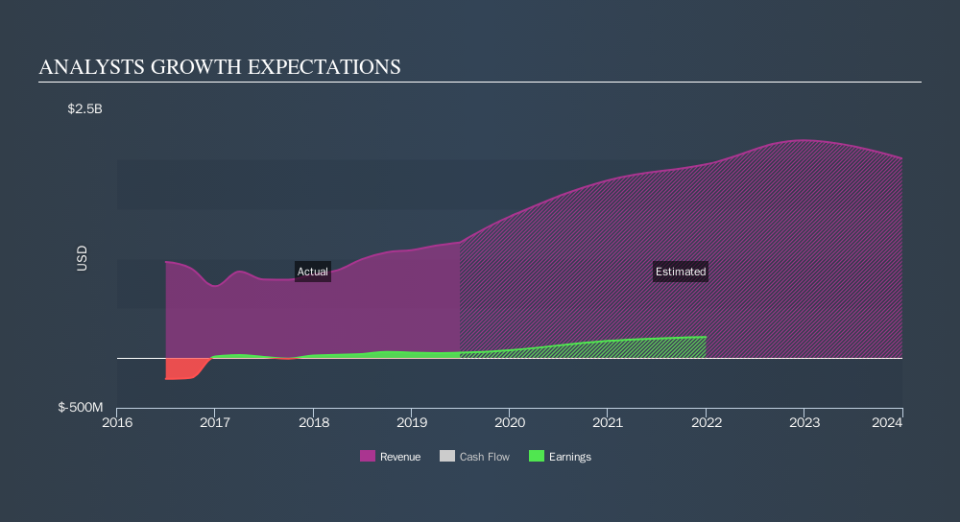
One reason why investors are attracted to GTLS is its notable earnings growth potential in the near future of 52%. Earnings growth is paired with an eye-catching top-line trajectory of 61%, which indicates a high-quality bottom-line expansion, as opposed to those driven simple by unsustainable cost-cutting activities. GTLS is currently trading below its true value, which means the market is undervaluing the company's expected cash flow going forward. This mispricing gives investors the opportunity to buy into the stock at a cheap price compared to the value they will be receiving, should analysts' consensus forecast growth be correct. Compared to the rest of the capital goods industry, GTLS is also trading below its peers of similar sizes in terms of their assets. This supports the theory that GTLS is potentially underpriced.
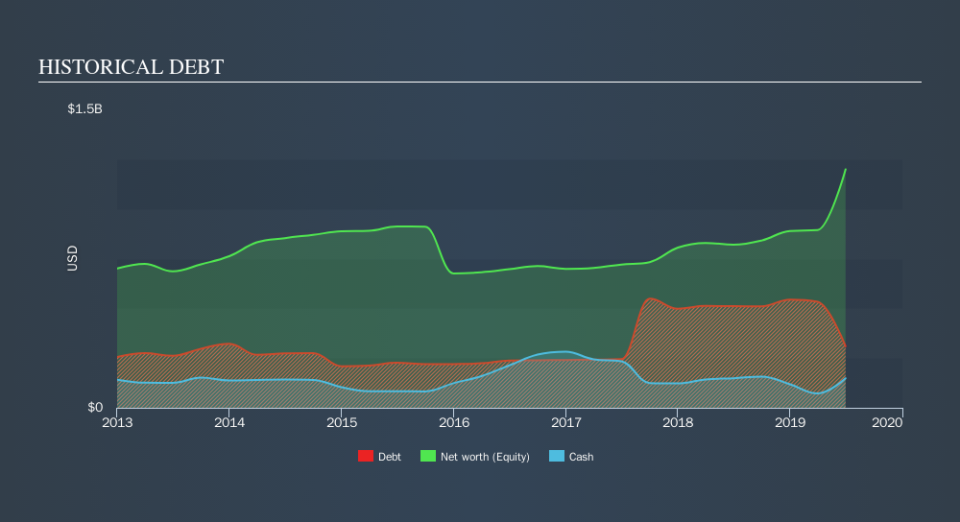
GTLS is financially robust, with ample cash on hand and short-term investments to meet upcoming liabilities. This suggests prudent control over cash and cost by management, which is a key determinant of the company’s health. GTLS’s debt-to-equity ratio stands at 26%, which means its debt level is reasonable. This implies that GTLS has a healthy balance between taking advantage of low cost debt funding as well as sufficient financial flexibility without succumbing to the strict terms of debt.
Next Steps:
For Chart Industries, there are three important aspects you should further research:
Historical Performance: What has GTLS's returns been like over the past? Go into more detail in the past track record analysis and take a look at the free visual representations of our analysis for more clarity.
Dividend Income vs Capital Gains: Does GTLS return gains to shareholders through reinvesting in itself and growing earnings, or redistribute a decent portion of earnings as dividends? Our historical dividend yield visualization quickly tells you what your can expect from GTLS as an investment.
Other Attractive Alternatives : Are there other well-rounded stocks you could be holding instead of GTLS? Explore our interactive list of stocks with large potential to get an idea of what else is out there you may be missing!
We aim to bring you long-term focused research analysis driven by fundamental data. Note that our analysis may not factor in the latest price-sensitive company announcements or qualitative material.
If you spot an error that warrants correction, please contact the editor at editorial-team@simplywallst.com. This article by Simply Wall St is general in nature. It does not constitute a recommendation to buy or sell any stock, and does not take account of your objectives, or your financial situation. Simply Wall St has no position in the stocks mentioned. Thank you for reading.
