
 Yahoo Finance
 Some Confidence Is Lacking In Zillow Group, Inc.'s (NASDAQ:ZG) P/S
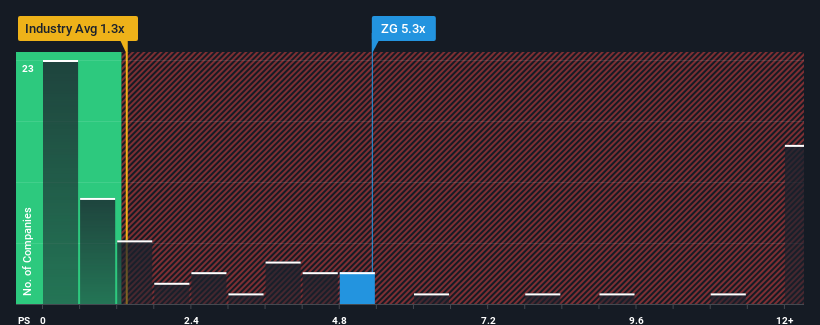
When you see that almost half of the companies in the Real Estate industry in the United States have price-to-sales ratios (or "P/S") below 1.3x, Zillow Group, Inc. (NASDAQ:ZG) looks to be giving off strong sell signals with its 5.3x P/S ratio. Nonetheless, we'd need to dig a little deeper to determine if there is a rational basis for the highly elevated P/S.
See our latest analysis for Zillow Group
What Does Zillow Group's P/S Mean For Shareholders?
While the industry has experienced revenue growth lately, Zillow Group's revenue has gone into reverse gear, which is not great. One possibility is that the P/S ratio is high because investors think this poor revenue performance will turn the corner. If not, then existing shareholders may be extremely nervous about the viability of the share price.
Want the full picture on analyst estimates for the company? Then our free report on Zillow Group will help you uncover what's on the horizon.
Do Revenue Forecasts Match The High P/S Ratio?
Zillow Group's P/S ratio would be typical for a company that's expected to deliver very strong growth, and importantly, perform much better than the industry.
Retrospectively, the last year delivered a frustrating 8.2% decrease to the company's top line. The last three years don't look nice either as the company has shrunk revenue by 29% in aggregate. Accordingly, shareholders would have felt downbeat about the medium-term rates of revenue growth.
Shifting to the future, estimates from the analysts covering the company suggest revenue should grow by 7.4% per year over the next three years. That's shaping up to be similar to the 7.5% per year growth forecast for the broader industry.
With this information, we find it interesting that Zillow Group is trading at a high P/S compared to the industry. It seems most investors are ignoring the fairly average growth expectations and are willing to pay up for exposure to the stock. Although, additional gains will be difficult to achieve as this level of revenue growth is likely to weigh down the share price eventually.
What We Can Learn From Zillow Group's P/S?
We'd say the price-to-sales ratio's power isn't primarily as a valuation instrument but rather to gauge current investor sentiment and future expectations.
Given Zillow Group's future revenue forecasts are in line with the wider industry, the fact that it trades at an elevated P/S is somewhat surprising. When we see revenue growth that just matches the industry, we don't expect elevates P/S figures to remain inflated for the long-term. A positive change is needed in order to justify the current price-to-sales ratio.
A lot of potential risks can sit within a company's balance sheet. Take a look at our free balance sheet analysis for Zillow Group with six simple checks on some of these key factors.
Of course, profitable companies with a history of great earnings growth are generally safer bets. So you may wish to see this free collection of other companies that have reasonable P/E ratios and have grown earnings strongly.
Have feedback on this article? Concerned about the content? Get in touch with us directly. Alternatively, email editorial-team (at) simplywallst.com.
This article by Simply Wall St is general in nature. We provide commentary based on historical data and analyst forecasts only using an unbiased methodology and our articles are not intended to be financial advice. It does not constitute a recommendation to buy or sell any stock, and does not take account of your objectives, or your financial situation. We aim to bring you long-term focused analysis driven by fundamental data. Note that our analysis may not factor in the latest price-sensitive company announcements or qualitative material. Simply Wall St has no position in any stocks mentioned.
Join A Paid User Research Session
You’ll receive a US$30 Amazon Gift card for 1 hour of your time while helping us build better investing tools for the individual investors like yourself. Sign up here
