
 Yahoo Finance
 Should You Be Concerned About MGM China Holdings Limited’s (HKG:2282) Earnings Growth?

Assessing MGM China Holdings Limited’s (HKG:2282) past track record of performance is a useful exercise for investors. It allows us to understand whether the company has met or exceed expectations, which is a great indicator for future performance. Below, I assess 2282’s latest performance announced on 31 December 2017 and evaluate these figures to its historical trend and industry movements.
See our latest analysis for MGM China Holdings
How Well Did 2282 Perform?
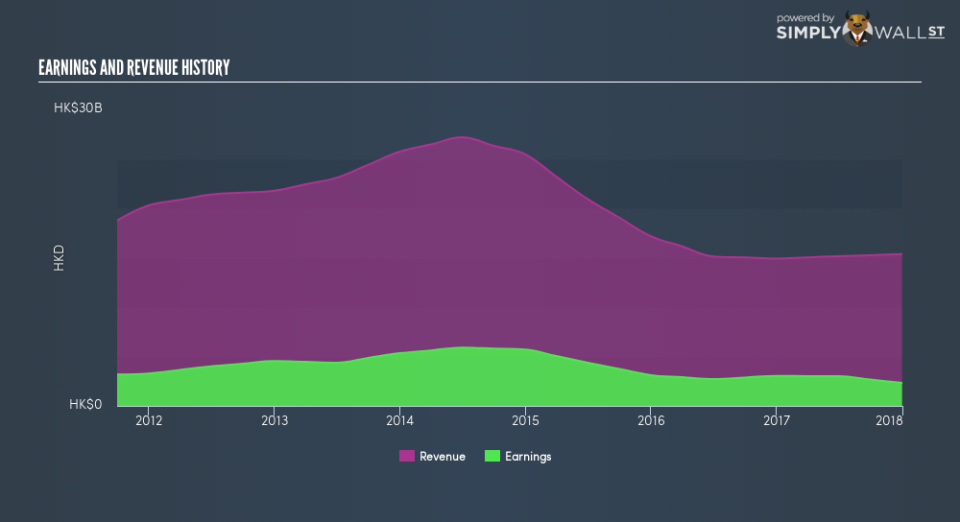
2282’s trailing twelve-month earnings (from 31 December 2017) of HK$2.32b has declined by -23.59% compared to the previous year. Furthermore, this one-year growth rate has been lower than its average earnings growth rate over the past 5 years of -6.43%, indicating the rate at which 2282 is growing has slowed down. Why could this be happening? Well, let’s take a look at what’s going on with margins and whether the whole industry is facing the same headwind.
In the last couple of years, MGM China Holdings has, on average, delivered negative top- and bottom-line growth. As revenues fell by more, expenses have been slashed in order to sustain margins – not the most sustainable operating activity. Eyeballing growth from a sector-level, the HK hospitality industry has been growing its average earnings by double-digit 17.56% in the past twelve months, and a flatter -1.48% over the last five years. This growth is a median of profitable companies of 24 Hospitality companies in HK including Melco International Development, Taste Gourmet Group and Fresh Express Delivery Holdings Group. This means in the recent industry expansion, MGM China Holdings has not been able to gain as much as its industry peers.
In terms of returns from investment, MGM China Holdings has invested its equity funds well leading to a 27.26% return on equity (ROE), above the sensible minimum of 20%. Furthermore, its return on assets (ROA) of 6.32% exceeds the HK Hospitality industry of 4.11%, indicating MGM China Holdings has used its assets more efficiently. However, its return on capital (ROC), which also accounts for MGM China Holdings’s debt level, has declined over the past 3 years from 52.05% to 12.84%. This correlates with an increase in debt holding, with debt-to-equity ratio rising from 67.56% to 209.57% over the past 5 years.
What does this mean?
Though MGM China Holdings’s past data is helpful, it is only one aspect of my investment thesis. Typically companies that endure a drawn out period of reduction in earnings are going through some sort of reinvestment phase with the aim of keeping up with the recent industry growth and disruption. I recommend you continue to research MGM China Holdings to get a better picture of the stock by looking at:
Future Outlook: What are well-informed industry analysts predicting for 2282’s future growth? Take a look at our free research report of analyst consensus for 2282’s outlook.
Financial Health: Are 2282’s operations financially sustainable? Balance sheets can be hard to analyze, which is why we’ve done it for you. Check out our financial health checks here.
Other High-Performing Stocks: Are there other stocks that provide better prospects with proven track records? Explore our free list of these great stocks here.
NB: Figures in this article are calculated using data from the trailing twelve months from 31 December 2017. This may not be consistent with full year annual report figures.
To help readers see past the short term volatility of the financial market, we aim to bring you a long-term focused research analysis purely driven by fundamental data. Note that our analysis does not factor in the latest price-sensitive company announcements.
The author is an independent contributor and at the time of publication had no position in the stocks mentioned. For errors that warrant correction please contact the editor at editorial-team@simplywallst.com.
