
 Yahoo Finance
 Is Codan Limited's (ASX:CDA) High P/E Ratio A Problem For Investors?

This article is for investors who would like to improve their understanding of price to earnings ratios (P/E ratios). We'll apply a basic P/E ratio analysis to Codan Limited's (ASX:CDA), to help you decide if the stock is worth further research. What is Codan's P/E ratio? Well, based on the last twelve months it is 30.65. That means that at current prices, buyers pay A$30.65 for every A$1 in trailing yearly profits.
See our latest analysis for Codan
How Do You Calculate A P/E Ratio?
The formula for P/E is:
Price to Earnings Ratio = Price per Share ÷ Earnings per Share (EPS)
Or for Codan:
P/E of 30.65 = AUD7.82 ÷ AUD0.26 (Based on the year to June 2019.)
Is A High Price-to-Earnings Ratio Good?
A higher P/E ratio means that buyers have to pay a higher price for each AUD1 the company has earned over the last year. That isn't necessarily good or bad, but a high P/E implies relatively high expectations of what a company can achieve in the future.
Does Codan Have A Relatively High Or Low P/E For Its Industry?
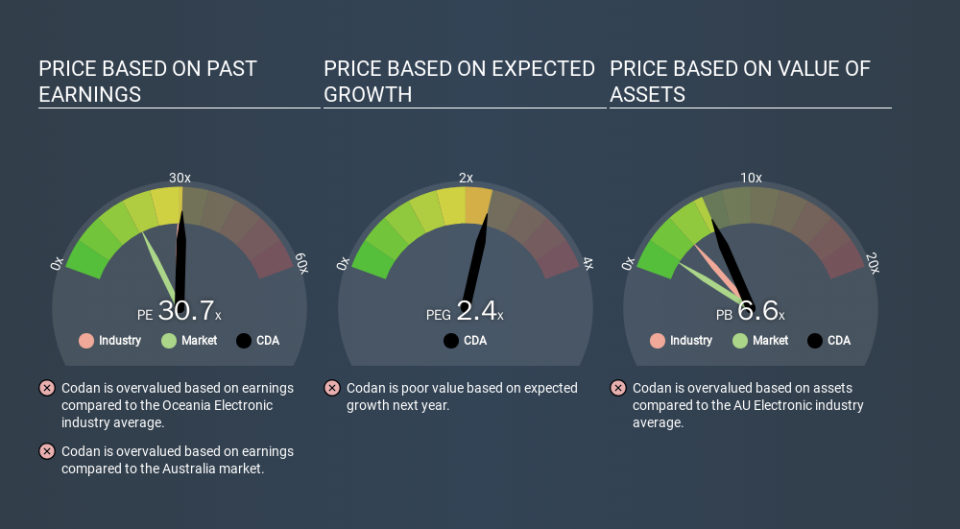
The P/E ratio indicates whether the market has higher or lower expectations of a company. As you can see below Codan has a P/E ratio that is fairly close for the average for the electronic industry, which is 30.7.
That indicates that the market expects Codan will perform roughly in line with other companies in its industry. So if Codan actually outperforms its peers going forward, that should be a positive for the share price. Further research into factors such as insider buying and selling, could help you form your own view on whether that is likely.
How Growth Rates Impact P/E Ratios
Generally speaking the rate of earnings growth has a profound impact on a company's P/E multiple. That's because companies that grow earnings per share quickly will rapidly increase the 'E' in the equation. That means even if the current P/E is high, it will reduce over time if the share price stays flat. Then, a lower P/E should attract more buyers, pushing the share price up.
Codan's earnings per share grew by -9.2% in the last twelve months. And it has bolstered its earnings per share by 37% per year over the last five years.
Don't Forget: The P/E Does Not Account For Debt or Bank Deposits
The 'Price' in P/E reflects the market capitalization of the company. Thus, the metric does not reflect cash or debt held by the company. Theoretically, a business can improve its earnings (and produce a lower P/E in the future) by investing in growth. That means taking on debt (or spending its cash).
Such expenditure might be good or bad, in the long term, but the point here is that the balance sheet is not reflected by this ratio.
Codan's Balance Sheet
Codan has net cash of AU$38m. That should lead to a higher P/E than if it did have debt, because its strong balance sheets gives it more options.
The Bottom Line On Codan's P/E Ratio
Codan has a P/E of 30.7. That's higher than the average in its market, which is 18.8. EPS was up modestly better over the last twelve months. And the healthy balance sheet means the company can sustain growth while the P/E suggests shareholders think it will.
Investors should be looking to buy stocks that the market is wrong about. People often underestimate remarkable growth -- so investors can make money when fast growth is not fully appreciated. So this free visualization of the analyst consensus on future earnings could help you make the right decision about whether to buy, sell, or hold.
But note: Codan may not be the best stock to buy. So take a peek at this free list of interesting companies with strong recent earnings growth (and a P/E ratio below 20).
If you spot an error that warrants correction, please contact the editor at editorial-team@simplywallst.com. This article by Simply Wall St is general in nature. It does not constitute a recommendation to buy or sell any stock, and does not take account of your objectives, or your financial situation. Simply Wall St has no position in the stocks mentioned.
We aim to bring you long-term focused research analysis driven by fundamental data. Note that our analysis may not factor in the latest price-sensitive company announcements or qualitative material. Thank you for reading.
