
 Yahoo Finance
 Is CMS Energy (NYSE:CMS) Using Too Much Debt?

The external fund manager backed by Berkshire Hathaway's Charlie Munger, Li Lu, makes no bones about it when he says 'The biggest investment risk is not the volatility of prices, but whether you will suffer a permanent loss of capital.' When we think about how risky a company is, we always like to look at its use of debt, since debt overload can lead to ruin. Importantly, CMS Energy Corporation (NYSE:CMS) does carry debt. But the more important question is: how much risk is that debt creating?
What Risk Does Debt Bring?
Generally speaking, debt only becomes a real problem when a company can't easily pay it off, either by raising capital or with its own cash flow. If things get really bad, the lenders can take control of the business. However, a more common (but still painful) scenario is that it has to raise new equity capital at a low price, thus permanently diluting shareholders. By replacing dilution, though, debt can be an extremely good tool for businesses that need capital to invest in growth at high rates of return. The first step when considering a company's debt levels is to consider its cash and debt together.
Check out our latest analysis for CMS Energy
How Much Debt Does CMS Energy Carry?
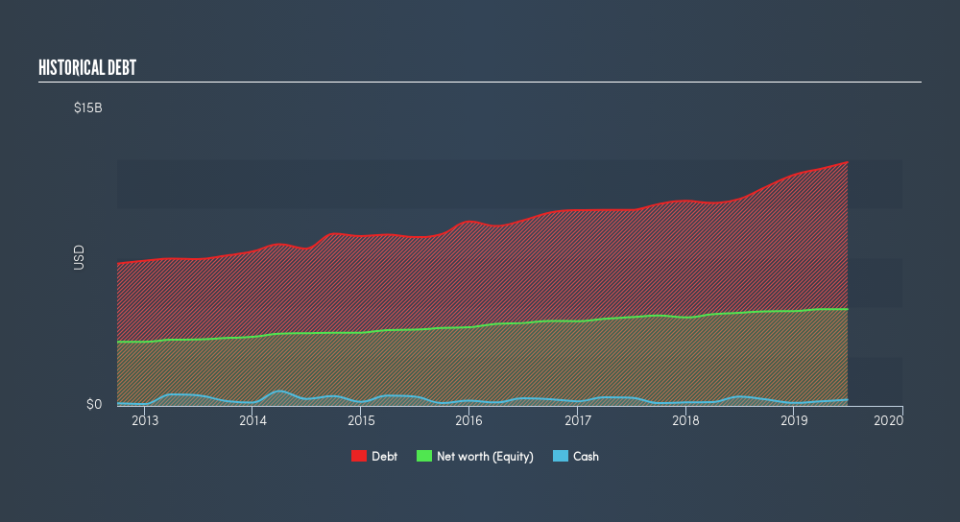
As you can see below, at the end of June 2019, CMS Energy had US$12.3b of debt, up from US$10.6b a year ago. Click the image for more detail. However, because it has a cash reserve of US$312.0m, its net debt is less, at about US$12.0b.
How Healthy Is CMS Energy's Balance Sheet?
According to the last reported balance sheet, CMS Energy had liabilities of US$2.39b due within 12 months, and liabilities of US$18.0b due beyond 12 months. On the other hand, it had cash of US$312.0m and US$1.02b worth of receivables due within a year. So it has liabilities totalling US$19.1b more than its cash and near-term receivables, combined.
When you consider that this deficiency exceeds the company's huge US$17.9b market capitalization, you might well be inclined to review the balance sheet, just like one might study a new partner's social media. Hypothetically, extremely heavy dilution would be required if the company were forced to pay down its liabilities by raising capital at the current share price.
In order to size up a company's debt relative to its earnings, we calculate its net debt divided by its earnings before interest, tax, depreciation, and amortization (EBITDA) and its earnings before interest and tax (EBIT) divided by its interest expense (its interest cover). This way, we consider both the absolute quantum of the debt, as well as the interest rates paid on it.
CMS Energy has a rather high debt to EBITDA ratio of 5.9 which suggests a meaningful debt load. But the good news is that it boasts fairly comforting interest cover of 2.5 times, suggesting it can responsibly service its obligations. Another concern for investors might be that CMS Energy's EBIT fell 13% in the last year. If things keep going like that, handling the debt will about as easy as bundling an angry house cat into its travel box. There's no doubt that we learn most about debt from the balance sheet. But ultimately the future profitability of the business will decide if CMS Energy can strengthen its balance sheet over time. So if you want to see what the professionals think, you might find this free report on analyst profit forecasts to be interesting.
But our final consideration is also important, because a company cannot pay debt with paper profits; it needs cold hard cash. So the logical step is to look at the proportion of that EBIT that is matched by actual free cash flow. Over the last three years, CMS Energy recorded negative free cash flow, in total. Debt is usually more expensive, and almost always more risky in the hands of a company with negative free cash flow. Shareholders ought to hope for and improvement.
Our View
On the face of it, CMS Energy's conversion of EBIT to free cash flow left us tentative about the stock, and its net debt to EBITDA was no more enticing than the one empty restaurant on the busiest night of the year. And even its EBIT growth rate fails to inspire much confidence. We should also note that Integrated Utilities industry companies like CMS Energy commonly do use debt without problems. After considering the datapoints discussed, we think CMS Energy has too much debt. That sort of riskiness is ok for some, but it certainly doesn't float our boat. Given the risks around CMS Energy's use of debt, the sensible thing to do is to check if insiders have been unloading the stock.
At the end of the day, it's often better to focus on companies that are free from net debt. You can access our special list of such companies (all with a track record of profit growth). It's free.
We aim to bring you long-term focused research analysis driven by fundamental data. Note that our analysis may not factor in the latest price-sensitive company announcements or qualitative material.
If you spot an error that warrants correction, please contact the editor at editorial-team@simplywallst.com. This article by Simply Wall St is general in nature. It does not constitute a recommendation to buy or sell any stock, and does not take account of your objectives, or your financial situation. Simply Wall St has no position in the stocks mentioned. Thank you for reading.
