
 Yahoo Finance
 A Closer Look At Eagers Automotive Limited's (ASX:APE) Impressive ROE
Many investors are still learning about the various metrics that can be useful when analysing a stock. This article is for those who would like to learn about Return On Equity (ROE). We'll use ROE to examine Eagers Automotive Limited (ASX:APE), by way of a worked example.
Return on equity or ROE is an important factor to be considered by a shareholder because it tells them how effectively their capital is being reinvested. In short, ROE shows the profit each dollar generates with respect to its shareholder investments.
See our latest analysis for Eagers Automotive
How Do You Calculate Return On Equity?
ROE can be calculated by using the formula:
Return on Equity = Net Profit (from continuing operations) ÷ Shareholders' Equity
So, based on the above formula, the ROE for Eagers Automotive is:
23% = AU$299m ÷ AU$1.3b (Based on the trailing twelve months to December 2023).
The 'return' is the income the business earned over the last year. That means that for every A$1 worth of shareholders' equity, the company generated A$0.23 in profit.
Does Eagers Automotive Have A Good Return On Equity?
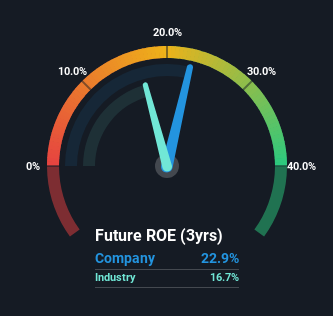
One simple way to determine if a company has a good return on equity is to compare it to the average for its industry. However, this method is only useful as a rough check, because companies do differ quite a bit within the same industry classification. As you can see in the graphic below, Eagers Automotive has a higher ROE than the average (17%) in the Specialty Retail industry.
That's clearly a positive. However, bear in mind that a high ROE doesn’t necessarily indicate efficient profit generation. Aside from changes in net income, a high ROE can also be the outcome of high debt relative to equity, which indicates risk. To know the 4 risks we have identified for Eagers Automotive visit our risks dashboard for free.
How Does Debt Impact ROE?
Companies usually need to invest money to grow their profits. That cash can come from issuing shares, retained earnings, or debt. In the first and second cases, the ROE will reflect this use of cash for investment in the business. In the latter case, the debt used for growth will improve returns, but won't affect the total equity. That will make the ROE look better than if no debt was used.
Combining Eagers Automotive's Debt And Its 23% Return On Equity
It's worth noting the high use of debt by Eagers Automotive, leading to its debt to equity ratio of 1.38. There's no doubt the ROE is impressive, but it's worth keeping in mind that the metric could have been lower if the company were to reduce its debt. Debt does bring extra risk, so it's only really worthwhile when a company generates some decent returns from it.
Summary
Return on equity is one way we can compare its business quality of different companies. In our books, the highest quality companies have high return on equity, despite low debt. All else being equal, a higher ROE is better.
But ROE is just one piece of a bigger puzzle, since high quality businesses often trade on high multiples of earnings. The rate at which profits are likely to grow, relative to the expectations of profit growth reflected in the current price, must be considered, too. So I think it may be worth checking this free report on analyst forecasts for the company.
But note: Eagers Automotive may not be the best stock to buy. So take a peek at this free list of interesting companies with high ROE and low debt.
Have feedback on this article? Concerned about the content? Get in touch with us directly. Alternatively, email editorial-team (at) simplywallst.com.
This article by Simply Wall St is general in nature. We provide commentary based on historical data and analyst forecasts only using an unbiased methodology and our articles are not intended to be financial advice. It does not constitute a recommendation to buy or sell any stock, and does not take account of your objectives, or your financial situation. We aim to bring you long-term focused analysis driven by fundamental data. Note that our analysis may not factor in the latest price-sensitive company announcements or qualitative material. Simply Wall St has no position in any stocks mentioned.
