
 Yahoo Finance
 A Close Look At REA Group Limited’s (ASX:REA) 28% ROCE

Today we are going to look at REA Group Limited (ASX:REA) to see whether it might be an attractive investment prospect. Specifically, we'll consider its Return On Capital Employed (ROCE), since that will give us an insight into how efficiently the business can generate profits from the capital it requires.
First up, we'll look at what ROCE is and how we calculate it. Second, we'll look at its ROCE compared to similar companies. Finally, we'll look at how its current liabilities affect its ROCE.
What is Return On Capital Employed (ROCE)?
ROCE is a measure of a company's yearly pre-tax profit (its return), relative to the capital employed in the business. Generally speaking a higher ROCE is better. Overall, it is a valuable metric that has its flaws. Renowned investment researcher Michael Mauboussin has suggested that a high ROCE can indicate that 'one dollar invested in the company generates value of more than one dollar'.
So, How Do We Calculate ROCE?
Analysts use this formula to calculate return on capital employed:
Return on Capital Employed = Earnings Before Interest and Tax (EBIT) ÷ (Total Assets - Current Liabilities)
Or for REA Group:
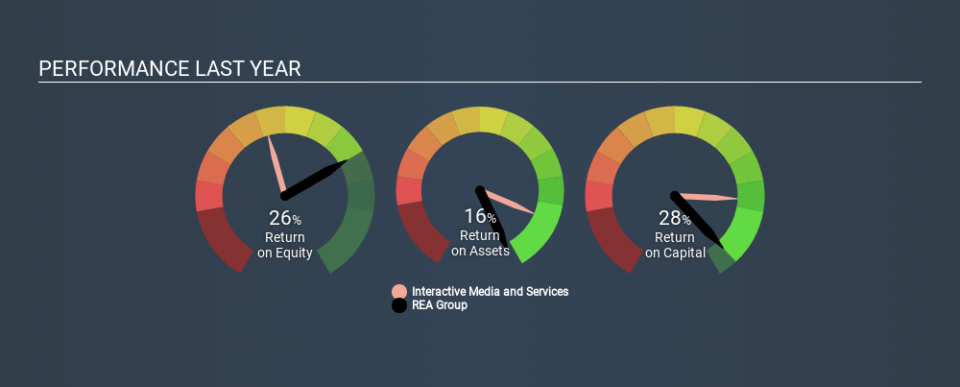
0.28 = AU$420m ÷ (AU$1.6b - AU$149m) (Based on the trailing twelve months to December 2019.)
So, REA Group has an ROCE of 28%.
View our latest analysis for REA Group
Is REA Group's ROCE Good?
When making comparisons between similar businesses, investors may find ROCE useful. REA Group's ROCE appears to be substantially greater than the 15% average in the Interactive Media and Services industry. I think that's good to see, since it implies the company is better than other companies at making the most of its capital. Regardless of the industry comparison, in absolute terms, REA Group's ROCE currently appears to be excellent.
You can click on the image below to see (in greater detail) how REA Group's past growth compares to other companies.
When considering ROCE, bear in mind that it reflects the past and does not necessarily predict the future. ROCE can be deceptive for cyclical businesses, as returns can look incredible in boom times, and terribly low in downturns. ROCE is, after all, simply a snap shot of a single year. Future performance is what matters, and you can see analyst predictions in our free report on analyst forecasts for the company.
Do REA Group's Current Liabilities Skew Its ROCE?
Current liabilities are short term bills and invoices that need to be paid in 12 months or less. The ROCE equation subtracts current liabilities from capital employed, so a company with a lot of current liabilities appears to have less capital employed, and a higher ROCE than otherwise. To check the impact of this, we calculate if a company has high current liabilities relative to its total assets.
REA Group has current liabilities of AU$149m and total assets of AU$1.6b. As a result, its current liabilities are equal to approximately 9.2% of its total assets. Minimal current liabilities are not distorting REA Group's impressive ROCE.
What We Can Learn From REA Group's ROCE
This should mark the company as worthy of further investigation. REA Group shapes up well under this analysis, but it is far from the only business delivering excellent numbers . You might also want to check this free collection of companies delivering excellent earnings growth.
If you are like me, then you will not want to miss this free list of growing companies that insiders are buying.
If you spot an error that warrants correction, please contact the editor at editorial-team@simplywallst.com. This article by Simply Wall St is general in nature. It does not constitute a recommendation to buy or sell any stock, and does not take account of your objectives, or your financial situation. Simply Wall St has no position in the stocks mentioned.
We aim to bring you long-term focused research analysis driven by fundamental data. Note that our analysis may not factor in the latest price-sensitive company announcements or qualitative material. Thank you for reading.
