
 Yahoo Finance
 Clarkson (LON:CKN) investors are sitting on a loss of 26% if they invested a year ago
Passive investing in an index fund is a good way to ensure your own returns roughly match the overall market. When you buy individual stocks, you can make higher profits, but you also face the risk of under-performance. That downside risk was realized by Clarkson PLC (LON:CKN) shareholders over the last year, as the share price declined 28%. That contrasts poorly with the market decline of 8.2%. The silver lining (for longer term investors) is that the stock is still 14% higher than it was three years ago. More recently, the share price has dropped a further 15% in a month.
It's worthwhile assessing if the company's economics have been moving in lockstep with these underwhelming shareholder returns, or if there is some disparity between the two. So let's do just that.
Check out our latest analysis for Clarkson
To paraphrase Benjamin Graham: Over the short term the market is a voting machine, but over the long term it's a weighing machine. One way to examine how market sentiment has changed over time is to look at the interaction between a company's share price and its earnings per share (EPS).
Clarkson managed to increase earnings per share from a loss to a profit, over the last 12 months.
Earnings per share growth rates aren't particularly useful for comparing with the share price, when a company has moved from loss to profit. But we may find different metrics more enlightening.
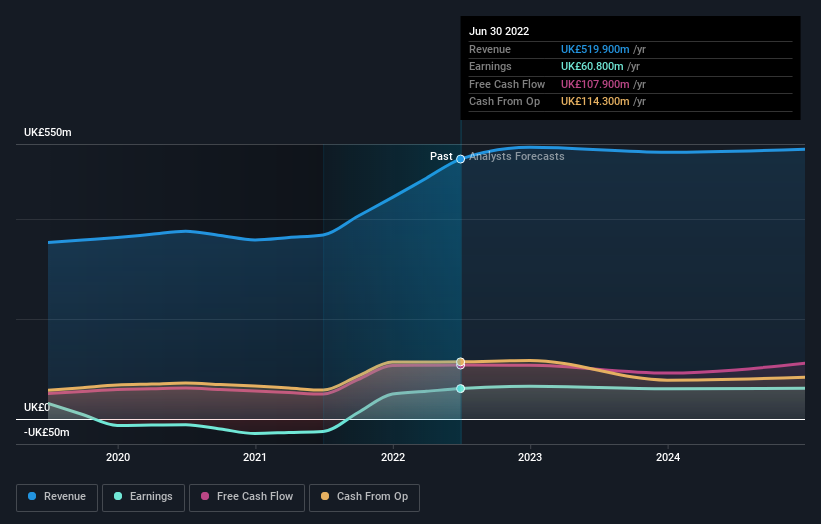
Clarkson's revenue is actually up 41% over the last year. Since we can't easily explain the share price movement based on these metrics, it might be worth considering how market sentiment has changed towards the stock.
The company's revenue and earnings (over time) are depicted in the image below (click to see the exact numbers).
We know that Clarkson has improved its bottom line lately, but what does the future have in store? If you are thinking of buying or selling Clarkson stock, you should check out this free report showing analyst profit forecasts.
A Different Perspective
While the broader market lost about 8.2% in the twelve months, Clarkson shareholders did even worse, losing 26% (even including dividends). However, it could simply be that the share price has been impacted by broader market jitters. It might be worth keeping an eye on the fundamentals, in case there's a good opportunity. On the bright side, long term shareholders have made money, with a gain of 2% per year over half a decade. If the fundamental data continues to indicate long term sustainable growth, the current sell-off could be an opportunity worth considering. While it is well worth considering the different impacts that market conditions can have on the share price, there are other factors that are even more important. Consider for instance, the ever-present spectre of investment risk. We've identified 2 warning signs with Clarkson (at least 1 which shouldn't be ignored) , and understanding them should be part of your investment process.
Of course Clarkson may not be the best stock to buy. So you may wish to see this free collection of growth stocks.
Please note, the market returns quoted in this article reflect the market weighted average returns of stocks that currently trade on GB exchanges.
Have feedback on this article? Concerned about the content? Get in touch with us directly. Alternatively, email editorial-team (at) simplywallst.com.
This article by Simply Wall St is general in nature. We provide commentary based on historical data and analyst forecasts only using an unbiased methodology and our articles are not intended to be financial advice. It does not constitute a recommendation to buy or sell any stock, and does not take account of your objectives, or your financial situation. We aim to bring you long-term focused analysis driven by fundamental data. Note that our analysis may not factor in the latest price-sensitive company announcements or qualitative material. Simply Wall St has no position in any stocks mentioned.
Join A Paid User Research Session
You’ll receive a US$30 Amazon Gift card for 1 hour of your time while helping us build better investing tools for the individual investors like yourself. Sign up here
