
 Yahoo Finance
 Church & Dwight Co., Inc. (NYSE:CHD) Earns Among The Best Returns In Its Industry

Today we’ll look at Church & Dwight Co., Inc. (NYSE:CHD) and reflect on its potential as an investment. Specifically, we’re going to calculate its Return On Capital Employed (ROCE), in the hopes of getting some insight into the business.
Firstly, we’ll go over how we calculate ROCE. Then we’ll compare its ROCE to similar companies. Last but not least, we’ll look at what impact its current liabilities have on its ROCE.
Return On Capital Employed (ROCE): What is it?
ROCE is a measure of a company’s yearly pre-tax profit (its return), relative to the capital employed in the business. Generally speaking a higher ROCE is better. Ultimately, it is a useful but imperfect metric. Renowned investment researcher Michael Mauboussin has suggested that a high ROCE can indicate that ‘one dollar invested in the company generates value of more than one dollar’.
So, How Do We Calculate ROCE?
Analysts use this formula to calculate return on capital employed:
Return on Capital Employed = Earnings Before Interest and Tax (EBIT) ÷ (Total Assets – Current Liabilities)
Or for Church & Dwight:
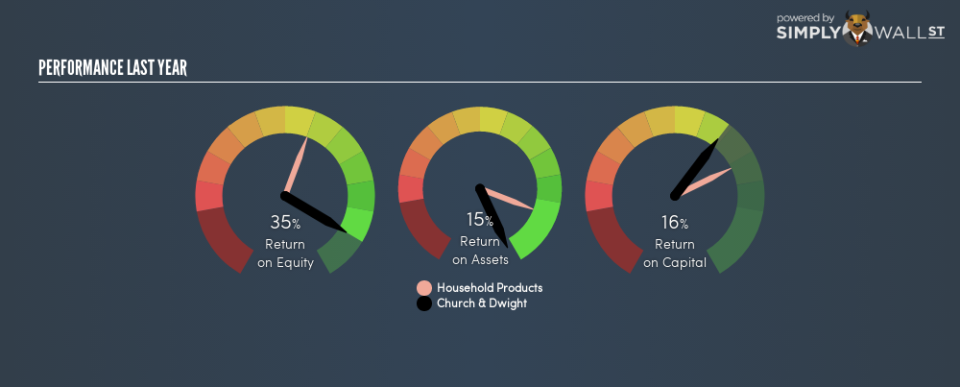
0.16 = US$772m ÷ (US$6.0b – US$1.0b) (Based on the trailing twelve months to September 2018.)
So, Church & Dwight has an ROCE of 16%.
Check out our latest analysis for Church & Dwight
Want to help shape the future of investing tools and platforms? Take the survey and be part of one of the most advanced studies of stock market investors to date.
Is Church & Dwight’s ROCE Good?
ROCE is commonly used for comparing the performance of similar businesses. Using our data, Church & Dwight’s ROCE appears to be around the 15% average of the Household Products industry. Regardless of where Church & Dwight sits next to its industry, its ROCE in absolute terms appears satisfactory, and this company could be worth a closer look.
Remember that this metric is backwards looking – it shows what has happened in the past, and does not accurately predict the future. Companies in cyclical industries can be difficult to understand using ROCE, as returns typically look high during boom times, and low during busts. ROCE is, after all, simply a snap shot of a single year. Since the future is so important for investors, you should check out our free report on analyst forecasts for Church & Dwight.
Do Church & Dwight’s Current Liabilities Skew Its ROCE?
Current liabilities include invoices, such as supplier payments, short-term debt, or a tax bill, that need to be paid within 12 months. Due to the way the ROCE equation works, having large bills due in the near term can make it look as though a company has less capital employed, and thus a higher ROCE than usual. To counter this, investors can check if a company has high current liabilities relative to total assets.
Church & Dwight has total liabilities of US$1.0b and total assets of US$6.0b. Therefore its current liabilities are equivalent to approximately 17% of its total assets. A fairly low level of current liabilities is not influencing the ROCE too much.
What We Can Learn From Church & Dwight’s ROCE
With that in mind, Church & Dwight’s ROCE appears pretty good. You might be able to find a better buy than Church & Dwight. If you want a selection of possible winners, check out this free list of interesting companies that trade on a P/E below 20 (but have proven they can grow earnings).
I will like Church & Dwight better if I see some big insider buys. While we wait, check out this free list of growing companies with considerable, recent, insider buying.
To help readers see past the short term volatility of the financial market, we aim to bring you a long-term focused research analysis purely driven by fundamental data. Note that our analysis does not factor in the latest price-sensitive company announcements.
The author is an independent contributor and at the time of publication had no position in the stocks mentioned. For errors that warrant correction please contact the editor at editorial-team@simplywallst.com.
