
 Yahoo Finance
 China Gold International Resources (TSE:CGG) pulls back 3.5% this week, but still delivers shareholders incredible 41% CAGR over 5 years
Long term investing can be life changing when you buy and hold the truly great businesses. While the best companies are hard to find, but they can generate massive returns over long periods. For example, the China Gold International Resources Corp. Ltd. (TSE:CGG) share price is up a whopping 374% in the last half decade, a handsome return for long term holders. If that doesn't get you thinking about long term investing, we don't know what will. On top of that, the share price is up 40% in about a quarter.
Although China Gold International Resources has shed CA$115m from its market cap this week, let's take a look at its longer term fundamental trends and see if they've driven returns.
View our latest analysis for China Gold International Resources
There is no denying that markets are sometimes efficient, but prices do not always reflect underlying business performance. One flawed but reasonable way to assess how sentiment around a company has changed is to compare the earnings per share (EPS) with the share price.
We know that China Gold International Resources has been profitable in the past. However, it made a loss in the last twelve months, suggesting profit may be an unreliable metric at this stage. So it might be better to look at other metrics to try to understand the share price.
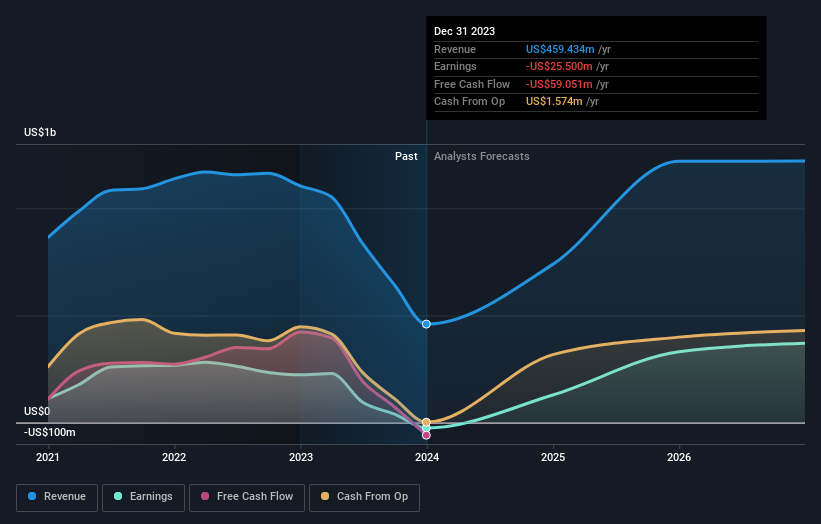
In contrast revenue growth of 7.6% per year is probably viewed as evidence that China Gold International Resources is growing, a real positive. It's quite possible that management are prioritizing revenue growth over EPS growth at the moment.
You can see how earnings and revenue have changed over time in the image below (click on the chart to see the exact values).
Balance sheet strength is crucial. It might be well worthwhile taking a look at our free report on how its financial position has changed over time.
What About The Total Shareholder Return (TSR)?
Investors should note that there's a difference between China Gold International Resources' total shareholder return (TSR) and its share price change, which we've covered above. Arguably the TSR is a more complete return calculation because it accounts for the value of dividends (as if they were reinvested), along with the hypothetical value of any discounted capital that have been offered to shareholders. Dividends have been really beneficial for China Gold International Resources shareholders, and that cash payout contributed to why its TSR of 462%, over the last 5 years, is better than the share price return.
A Different Perspective
It's nice to see that China Gold International Resources shareholders have received a total shareholder return of 18% over the last year. Having said that, the five-year TSR of 41% a year, is even better. Potential buyers might understandably feel they've missed the opportunity, but it's always possible business is still firing on all cylinders. While it is well worth considering the different impacts that market conditions can have on the share price, there are other factors that are even more important. Consider for instance, the ever-present spectre of investment risk. We've identified 1 warning sign with China Gold International Resources , and understanding them should be part of your investment process.
For those who like to find winning investments this free list of growing companies with recent insider purchasing, could be just the ticket.
Please note, the market returns quoted in this article reflect the market weighted average returns of stocks that currently trade on Canadian exchanges.
Have feedback on this article? Concerned about the content? Get in touch with us directly. Alternatively, email editorial-team (at) simplywallst.com.
This article by Simply Wall St is general in nature. We provide commentary based on historical data and analyst forecasts only using an unbiased methodology and our articles are not intended to be financial advice. It does not constitute a recommendation to buy or sell any stock, and does not take account of your objectives, or your financial situation. We aim to bring you long-term focused analysis driven by fundamental data. Note that our analysis may not factor in the latest price-sensitive company announcements or qualitative material. Simply Wall St has no position in any stocks mentioned.
