
 Yahoo Finance
 Chemring Group (LON:CHG) Might Have The Makings Of A Multi-Bagger
What trends should we look for it we want to identify stocks that can multiply in value over the long term? Ideally, a business will show two trends; firstly a growing return on capital employed (ROCE) and secondly, an increasing amount of capital employed. Basically this means that a company has profitable initiatives that it can continue to reinvest in, which is a trait of a compounding machine. Speaking of which, we noticed some great changes in Chemring Group's (LON:CHG) returns on capital, so let's have a look.
What Is Return On Capital Employed (ROCE)?
If you haven't worked with ROCE before, it measures the 'return' (pre-tax profit) a company generates from capital employed in its business. The formula for this calculation on Chemring Group is:
Return on Capital Employed = Earnings Before Interest and Tax (EBIT) ÷ (Total Assets - Current Liabilities)
0.15 = UK£70m ÷ (UK£596m - UK£142m) (Based on the trailing twelve months to October 2023).
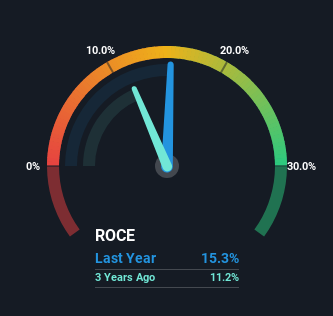
Thus, Chemring Group has an ROCE of 15%. On its own, that's a standard return, however it's much better than the 12% generated by the Aerospace & Defense industry.
View our latest analysis for Chemring Group
In the above chart we have measured Chemring Group's prior ROCE against its prior performance, but the future is arguably more important. If you'd like, you can check out the forecasts from the analysts covering Chemring Group for free.
The Trend Of ROCE
Shareholders will be relieved that Chemring Group has broken into profitability. While the business was unprofitable in the past, it's now turned things around and is earning 15% on its capital. While returns have increased, the amount of capital employed by Chemring Group has remained flat over the period. So while we're happy that the business is more efficient, just keep in mind that could mean that going forward the business is lacking areas to invest internally for growth. Because in the end, a business can only get so efficient.
What We Can Learn From Chemring Group's ROCE
In summary, we're delighted to see that Chemring Group has been able to increase efficiencies and earn higher rates of return on the same amount of capital. And a remarkable 176% total return over the last five years tells us that investors are expecting more good things to come in the future. Therefore, we think it would be worth your time to check if these trends are going to continue.
Like most companies, Chemring Group does come with some risks, and we've found 2 warning signs that you should be aware of.
For those who like to invest in solid companies, check out this free list of companies with solid balance sheets and high returns on equity.
Have feedback on this article? Concerned about the content? Get in touch with us directly. Alternatively, email editorial-team (at) simplywallst.com.
This article by Simply Wall St is general in nature. We provide commentary based on historical data and analyst forecasts only using an unbiased methodology and our articles are not intended to be financial advice. It does not constitute a recommendation to buy or sell any stock, and does not take account of your objectives, or your financial situation. We aim to bring you long-term focused analysis driven by fundamental data. Note that our analysis may not factor in the latest price-sensitive company announcements or qualitative material. Simply Wall St has no position in any stocks mentioned.
