
 Yahoo Finance
 Charter Hall Group's (ASX:CHC) Stock Been Rising: Are Strong Financials Guiding The Market?
Charter Hall Group's (ASX:CHC) stock is up by 4.2% over the past month. Since the market usually pay for a company’s long-term financial health, we decided to study the company’s fundamentals to see if they could be influencing the market. Specifically, we decided to study Charter Hall Group's ROE in this article.
ROE or return on equity is a useful tool to assess how effectively a company can generate returns on the investment it received from its shareholders. Simply put, it is used to assess the profitability of a company in relation to its equity capital.
See our latest analysis for Charter Hall Group
How To Calculate Return On Equity?
The formula for return on equity is:
Return on Equity = Net Profit (from continuing operations) ÷ Shareholders' Equity
So, based on the above formula, the ROE for Charter Hall Group is:
16% = AU$348m ÷ AU$2.1b (Based on the trailing twelve months to June 2020).
The 'return' refers to a company's earnings over the last year. That means that for every A$1 worth of shareholders' equity, the company generated A$0.16 in profit.
What Is The Relationship Between ROE And Earnings Growth?
We have already established that ROE serves as an efficient profit-generating gauge for a company's future earnings. Based on how much of its profits the company chooses to reinvest or "retain", we are then able to evaluate a company's future ability to generate profits. Assuming everything else remains unchanged, the higher the ROE and profit retention, the higher the growth rate of a company compared to companies that don't necessarily bear these characteristics.
Charter Hall Group's Earnings Growth And 16% ROE
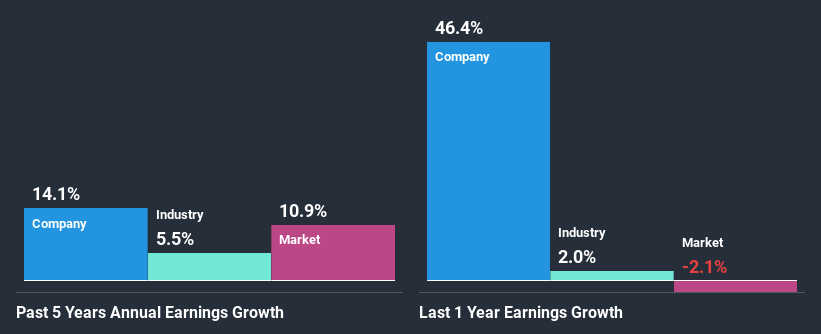
At first glance, Charter Hall Group seems to have a decent ROE. Especially when compared to the industry average of 6.6% the company's ROE looks pretty impressive. This certainly adds some context to Charter Hall Group's decent 14% net income growth seen over the past five years.
Next, on comparing with the industry net income growth, we found that Charter Hall Group's growth is quite high when compared to the industry average growth of 5.5% in the same period, which is great to see.
Earnings growth is a huge factor in stock valuation. It’s important for an investor to know whether the market has priced in the company's expected earnings growth (or decline). This then helps them determine if the stock is placed for a bright or bleak future. What is CHC worth today? The intrinsic value infographic in our free research report helps visualize whether CHC is currently mispriced by the market.
Is Charter Hall Group Efficiently Re-investing Its Profits?
Charter Hall Group seems to be paying out most of its income as dividends judging by its three-year median payout ratio of 81%, meaning the company retains only 19% of its income. However, this is typical for REITs as they are often required by law to distribute most of their earnings. In spite of this, the company was able to grow its earnings by a fair bit, as we saw above.
Besides, Charter Hall Group has been paying dividends for at least ten years or more. This shows that the company is committed to sharing profits with its shareholders. Our latest analyst data shows that the future payout ratio of the company is expected to drop to 60% over the next three years. However, the company's ROE is not expected to change by much despite the lower expected payout ratio.
Conclusion
In total, we are pretty happy with Charter Hall Group's performance. We are particularly impressed by the considerable earnings growth posted by the company, which was likely backed by its high ROE. While the company is paying out most of its earnings as dividends, it has been able to grow its earnings in spite of it, so that's probably a good sign. Having said that, on studying current analyst estimates, we were concerned to see that while the company has grown its earnings in the past, analysts expect its earnings to shrink in the future. To know more about the company's future earnings growth forecasts take a look at this free report on analyst forecasts for the company to find out more.
This article by Simply Wall St is general in nature. It does not constitute a recommendation to buy or sell any stock, and does not take account of your objectives, or your financial situation. We aim to bring you long-term focused analysis driven by fundamental data. Note that our analysis may not factor in the latest price-sensitive company announcements or qualitative material. Simply Wall St has no position in any stocks mentioned.
Have feedback on this article? Concerned about the content? Get in touch with us directly. Alternatively, email editorial-team (at) simplywallst.com.
