
 Yahoo Finance
 Is CF Industries Holdings, Inc. (NYSE:CF) A Smart Choice For Dividend Investors?

Today we'll take a closer look at CF Industries Holdings, Inc. (NYSE:CF) from a dividend investor's perspective. Owning a strong business and reinvesting the dividends is widely seen as an attractive way of growing your wealth. Yet sometimes, investors buy a popular dividend stock because of its yield, and then lose money if the company's dividend doesn't live up to expectations.
A 2.3% yield is nothing to get excited about, but investors probably think the long payment history suggests CF Industries Holdings has some staying power. The company also bought back stock equivalent to around 5.8% of market capitalisation this year. Some simple analysis can reduce the risk of holding CF Industries Holdings for its dividend, and we'll focus on the most important aspects below.
Explore this interactive chart for our latest analysis on CF Industries Holdings!
Payout ratios
Companies (usually) pay dividends out of their earnings. If a company is paying more than it earns, the dividend might have to be cut. So we need to form a view on if a company's dividend is sustainable, relative to its net profit after tax. In the last year, CF Industries Holdings paid out 60% of its profit as dividends. A payout ratio above 50% generally implies a business is reaching maturity, although it is still possible to reinvest in the business or increase the dividend over time.
We also measure dividends paid against a company's levered free cash flow, to see if enough cash was generated to cover the dividend. CF Industries Holdings's cash payout ratio last year was 24%, which is quite low and suggests that the dividend was thoroughly covered by cash flow. It's encouraging to see that the dividend is covered by both profit and cash flow. This generally suggests the dividend is sustainable, as long as earnings don't drop precipitously.
Is CF Industries Holdings's Balance Sheet Risky?
As CF Industries Holdings has a meaningful amount of debt, we need to check its balance sheet to see if the company might have debt risks. A rough way to check this is with these two simple ratios: a) net debt divided by EBITDA (earnings before interest, tax, depreciation and amortisation), and b) net interest cover. Net debt to EBITDA is a measure of a company's total debt. Net interest cover measures the ability to meet interest payments. Essentially we check that a) the company does not have too much debt, and b) that it can afford to pay the interest. With net debt of 2.13 times its EBITDA, CF Industries Holdings has a noticeable amount of debt, although if business stays steady, this may not be overly concerning.
Net interest cover can be calculated by dividing earnings before interest and tax (EBIT) by the company's net interest expense. Interest cover of 4.07 times its interest expense is starting to become a concern for CF Industries Holdings, and be aware that lenders may place additional restrictions on the company as well.
Consider getting our latest analysis on CF Industries Holdings's financial position here.
Dividend Volatility
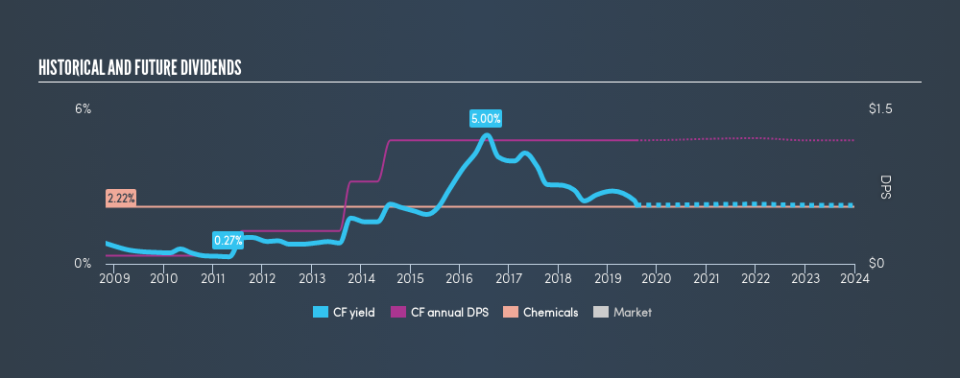
Before buying a stock for its income, we want to see if the dividends have been stable in the past, and if the company has a track record of maintaining its dividend. CF Industries Holdings has been paying dividends for a long time, but for the purpose of this analysis, we only examine the past 10 years of payments. During this period the dividend has been stable, which could imply the business could have relatively consistent earnings power. During the past ten-year period, the first annual payment was US$0.08 in 2009, compared to US$1.20 last year. This works out to be a compound annual growth rate (CAGR) of approximately 31% a year over that time.
It's rare to find a company that has grown its dividends rapidly over ten years and not had any notable cuts, but CF Industries Holdings has done it, which we really like.
Dividend Growth Potential
While dividend payments have been relatively reliable, it would also be nice if earnings per share (EPS) were growing, as this is essential to maintaining the dividend's purchasing power over the long term. CF Industries Holdings's earnings per share have shrunk at 17% a year over the past five years. A sharp decline in earnings per share is not great from from a dividend perspective, as even conservative payout ratios can come under pressure if earnings fall far enough.
Conclusion
To summarise, shareholders should always check that CF Industries Holdings's dividends are affordable, that its dividend payments are relatively stable, and that it has decent prospects for growing its earnings and dividend. First, we think CF Industries Holdings has an acceptable payout ratio and its dividend is well covered by cashflow. Earnings per share have not been growing, but we respect a company that maintains a relatively stable dividend. In sum, we find it hard to get excited about CF Industries Holdings from a dividend perspective. It's not that we think it's a bad business; just that there are other companies that perform better on these criteria.
Without at least some growth in earnings per share over time, the dividend will eventually come under pressure either from costs or inflation. Very few businesses see earnings consistently shrink year after year in perpetuity though, and so it might be worth seeing what the 19 analysts we track are forecasting for the future.
If you are a dividend investor, you might also want to look at our curated list of dividend stocks yielding above 3%.
We aim to bring you long-term focused research analysis driven by fundamental data. Note that our analysis may not factor in the latest price-sensitive company announcements or qualitative material.
If you spot an error that warrants correction, please contact the editor at editorial-team@simplywallst.com. This article by Simply Wall St is general in nature. It does not constitute a recommendation to buy or sell any stock, and does not take account of your objectives, or your financial situation. Simply Wall St has no position in the stocks mentioned. Thank you for reading.
