
 Yahoo Finance
 CBL Corporation Limited (NZE:CBL): Does The -23.34% Earnings Drop Reflect A Longer Term Trend?

When CBL Corporation Limited (NZSE:CBL) announced its most recent earnings (30 June 2017), I compared it against two factor: its historical earnings track record, and the performance of its industry peers on average. Being able to interpret how well CBL has done so far requires weighing its performance against a benchmark, rather than looking at a standalone number at a point in time. In this article, I’ve summarized the key takeaways on how I see CBL has performed. See our latest analysis for CBL
Commentary On CBL’s Past Performance
I look at data from the most recent 12 months, which either annualizes the most recent 6-month earnings update, or in some cases, the most recent annual report is already the latest available financial data. This blend allows me to analyze different companies in a uniform manner using new information. For CBL, its latest earnings (trailing twelve month) is NZ$23.95M, which, relative to the previous year’s figure, has fallen by -23.34%. Given that these values are relatively short-term thinking, I’ve created an annualized five-year value for CBL’s net income, which stands at NZ$26.81M This doesn’t look much better, as earnings seem to have gradually been deteriorating over the longer term.
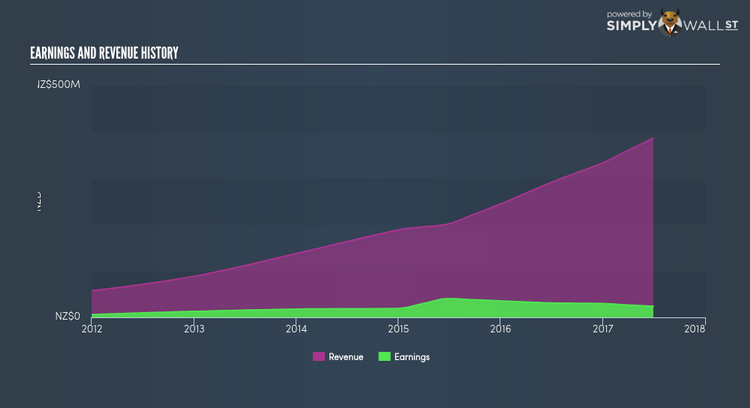
Why is this? Let’s examine what’s going on with margins and if the entire industry is facing the same headwind. Revenue growth over the last few years, has been positive, however, earnings growth has not been able to catch up, meaning CBL has been ramping up its expenses by a lot more. This hurts margins and earnings, and is not a sustainable practice. Viewing growth from a sector-level, the NZ insurance industry has been growing, albeit, at a unexciting single-digit rate of 4.83% over the prior year, and 8.44% over the previous five years. This means whatever recent headwind the industry is facing, it’s hitting CBL harder than its peers.
What does this mean?
While past data is useful, it doesn’t tell the whole story. In some cases, companies that experience a drawn out period of decline in earnings are undergoing some sort of reinvestment phase However, if the entire industry is struggling to grow over time, it may be a sign of a structural shift, which makes CBL and its peers a riskier investment. I suggest you continue to research CBL to get a more holistic view of the stock by looking at:
Financial Health: Is CBL’s operations financially sustainable? Balance sheets can be hard to analyze, which is why we’ve done it for you. Check out our financial health checks here.
Valuation: What is CBL worth today? Is the stock undervalued, even when its growth outlook is factored into its intrinsic value? The intrinsic value infographic in our free research report helps visualize whether CBL is currently mispriced by the market.
Other High-Performing Stocks: Are there other stocks that provide better prospects with proven track records? Explore our free list of these great stocks here.
NB: Figures in this article are calculated using data from the trailing twelve months from 30 June 2017. This may not be consistent with full year annual report figures.
To help readers see pass the short term volatility of the financial market, we aim to bring you a long-term focused research analysis purely driven by fundamental data. Note that our analysis does not factor in the latest price sensitive company announcements.
The author is an independent contributor and at the time of publication had no position in the stocks mentioned.
