
 Yahoo Finance
 Should We Be Cautious About Arconic Inc.'s (NYSE:ARNC) ROE Of 8.0%?

While some investors are already well versed in financial metrics (hat tip), this article is for those who would like to learn about Return On Equity (ROE) and why it is important. By way of learning-by-doing, we'll look at ROE to gain a better understanding of Arconic Inc. (NYSE:ARNC).
Our data shows Arconic has a return on equity of 8.0% for the last year. Another way to think of that is that for every $1 worth of equity in the company, it was able to earn $0.08.
See our latest analysis for Arconic
How Do I Calculate Return On Equity?
The formula for return on equity is:
Return on Equity = Net Profit (from continuing operations) ÷ Shareholders' Equity
Or for Arconic:
8.0% = US$379m ÷ US$4.7b (Based on the trailing twelve months to September 2019.)
Most readers would understand what net profit is, but it’s worth explaining the concept of shareholders’ equity. It is the capital paid in by shareholders, plus any retained earnings. The easiest way to calculate shareholders' equity is to subtract the company's total liabilities from the total assets.
What Does ROE Mean?
Return on Equity measures a company's profitability against the profit it has kept for the business (plus any capital injections). The 'return' is the yearly profit. A higher profit will lead to a higher ROE. So, all else equal, investors should like a high ROE. That means it can be interesting to compare the ROE of different companies.
Does Arconic Have A Good ROE?
One simple way to determine if a company has a good return on equity is to compare it to the average for its industry. However, this method is only useful as a rough check, because companies do differ quite a bit within the same industry classification. As is clear from the image below, Arconic has a lower ROE than the average (15%) in the Aerospace & Defense industry.
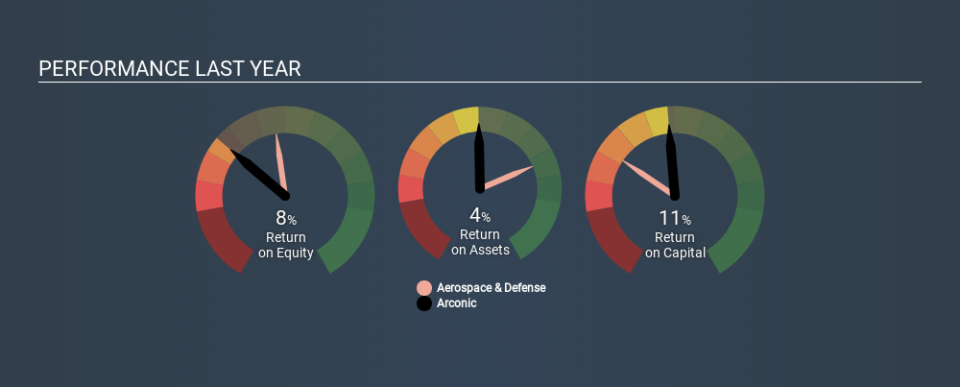
That certainly isn't ideal. We'd prefer see an ROE above the industry average, but it might not matter if the company is undervalued. Nonetheless, it could be useful to double-check if insiders have sold shares recently.
How Does Debt Impact ROE?
Companies usually need to invest money to grow their profits. That cash can come from retained earnings, issuing new shares (equity), or debt. In the first and second cases, the ROE will reflect this use of cash for investment in the business. In the latter case, the debt used for growth will improve returns, but won't affect the total equity. That will make the ROE look better than if no debt was used.
Combining Arconic's Debt And Its 8.0% Return On Equity
Arconic clearly uses a significant amount of debt to boost returns, as it has a debt to equity ratio of 1.35. Its ROE isn't too bad, but it would probably be very disappointing if the company had to stop using debt. Debt increases risk and reduces options for the company in the future, so you generally want to see some good returns from using it.
In Summary
Return on equity is useful for comparing the quality of different businesses. Companies that can achieve high returns on equity without too much debt are generally of good quality. If two companies have around the same level of debt to equity, and one has a higher ROE, I'd generally prefer the one with higher ROE.
But ROE is just one piece of a bigger puzzle, since high quality businesses often trade on high multiples of earnings. The rate at which profits are likely to grow, relative to the expectations of profit growth reflected in the current price, must be considered, too. So you might want to check this FREE visualization of analyst forecasts for the company.
If you would prefer check out another company -- one with potentially superior financials -- then do not miss thisfree list of interesting companies, that have HIGH return on equity and low debt.
If you spot an error that warrants correction, please contact the editor at editorial-team@simplywallst.com. This article by Simply Wall St is general in nature. It does not constitute a recommendation to buy or sell any stock, and does not take account of your objectives, or your financial situation. Simply Wall St has no position in the stocks mentioned.
We aim to bring you long-term focused research analysis driven by fundamental data. Note that our analysis may not factor in the latest price-sensitive company announcements or qualitative material. Thank you for reading.